> ## Documentation Index
> Fetch the complete documentation index at: https://docs.fire.rest/llms.txt
> Use this file to discover all available pages before exploring further.
# Reports
> Read BOH inventory reports: usage and consumption, waste, production yield, and stock balance at a date.
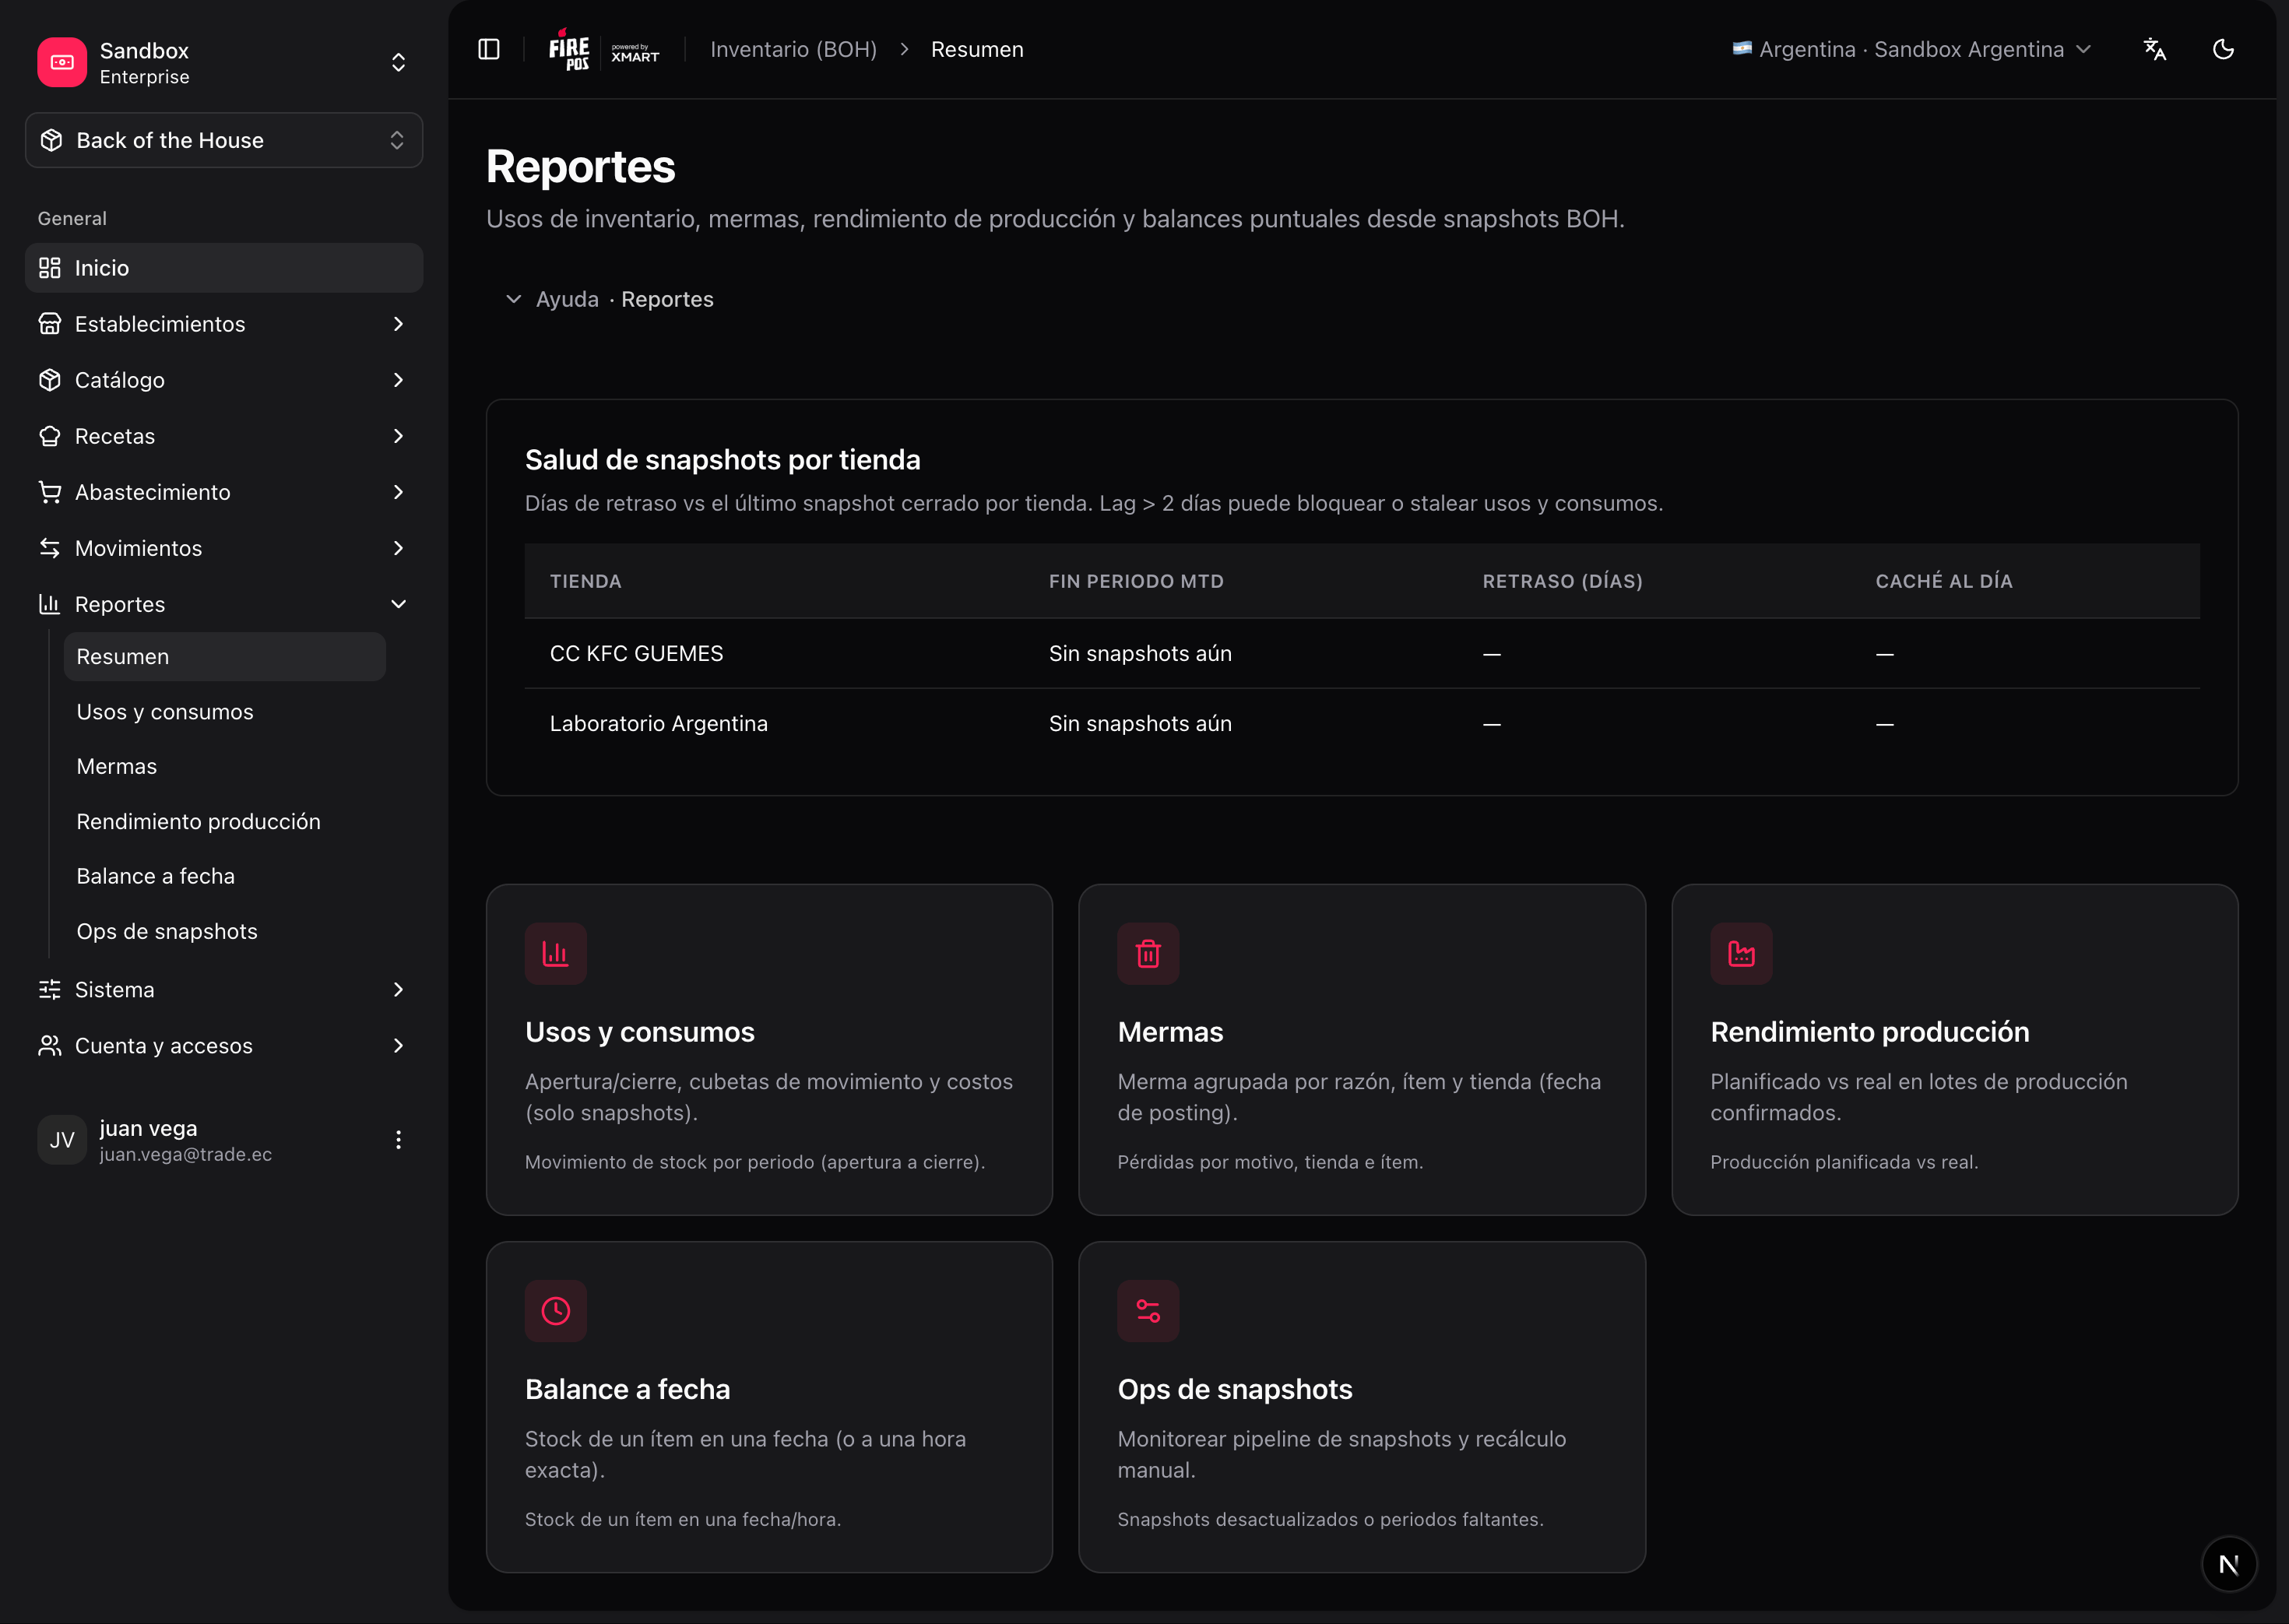
Reports summarize everything the operational documents recorded: what entered, what left and why, and how much should be on the shelf. All of them filter by store, item, and date range.
**Where you work:** **BOH → Reports** (`/boh/admin/reports`).
 ## Usage and consumption
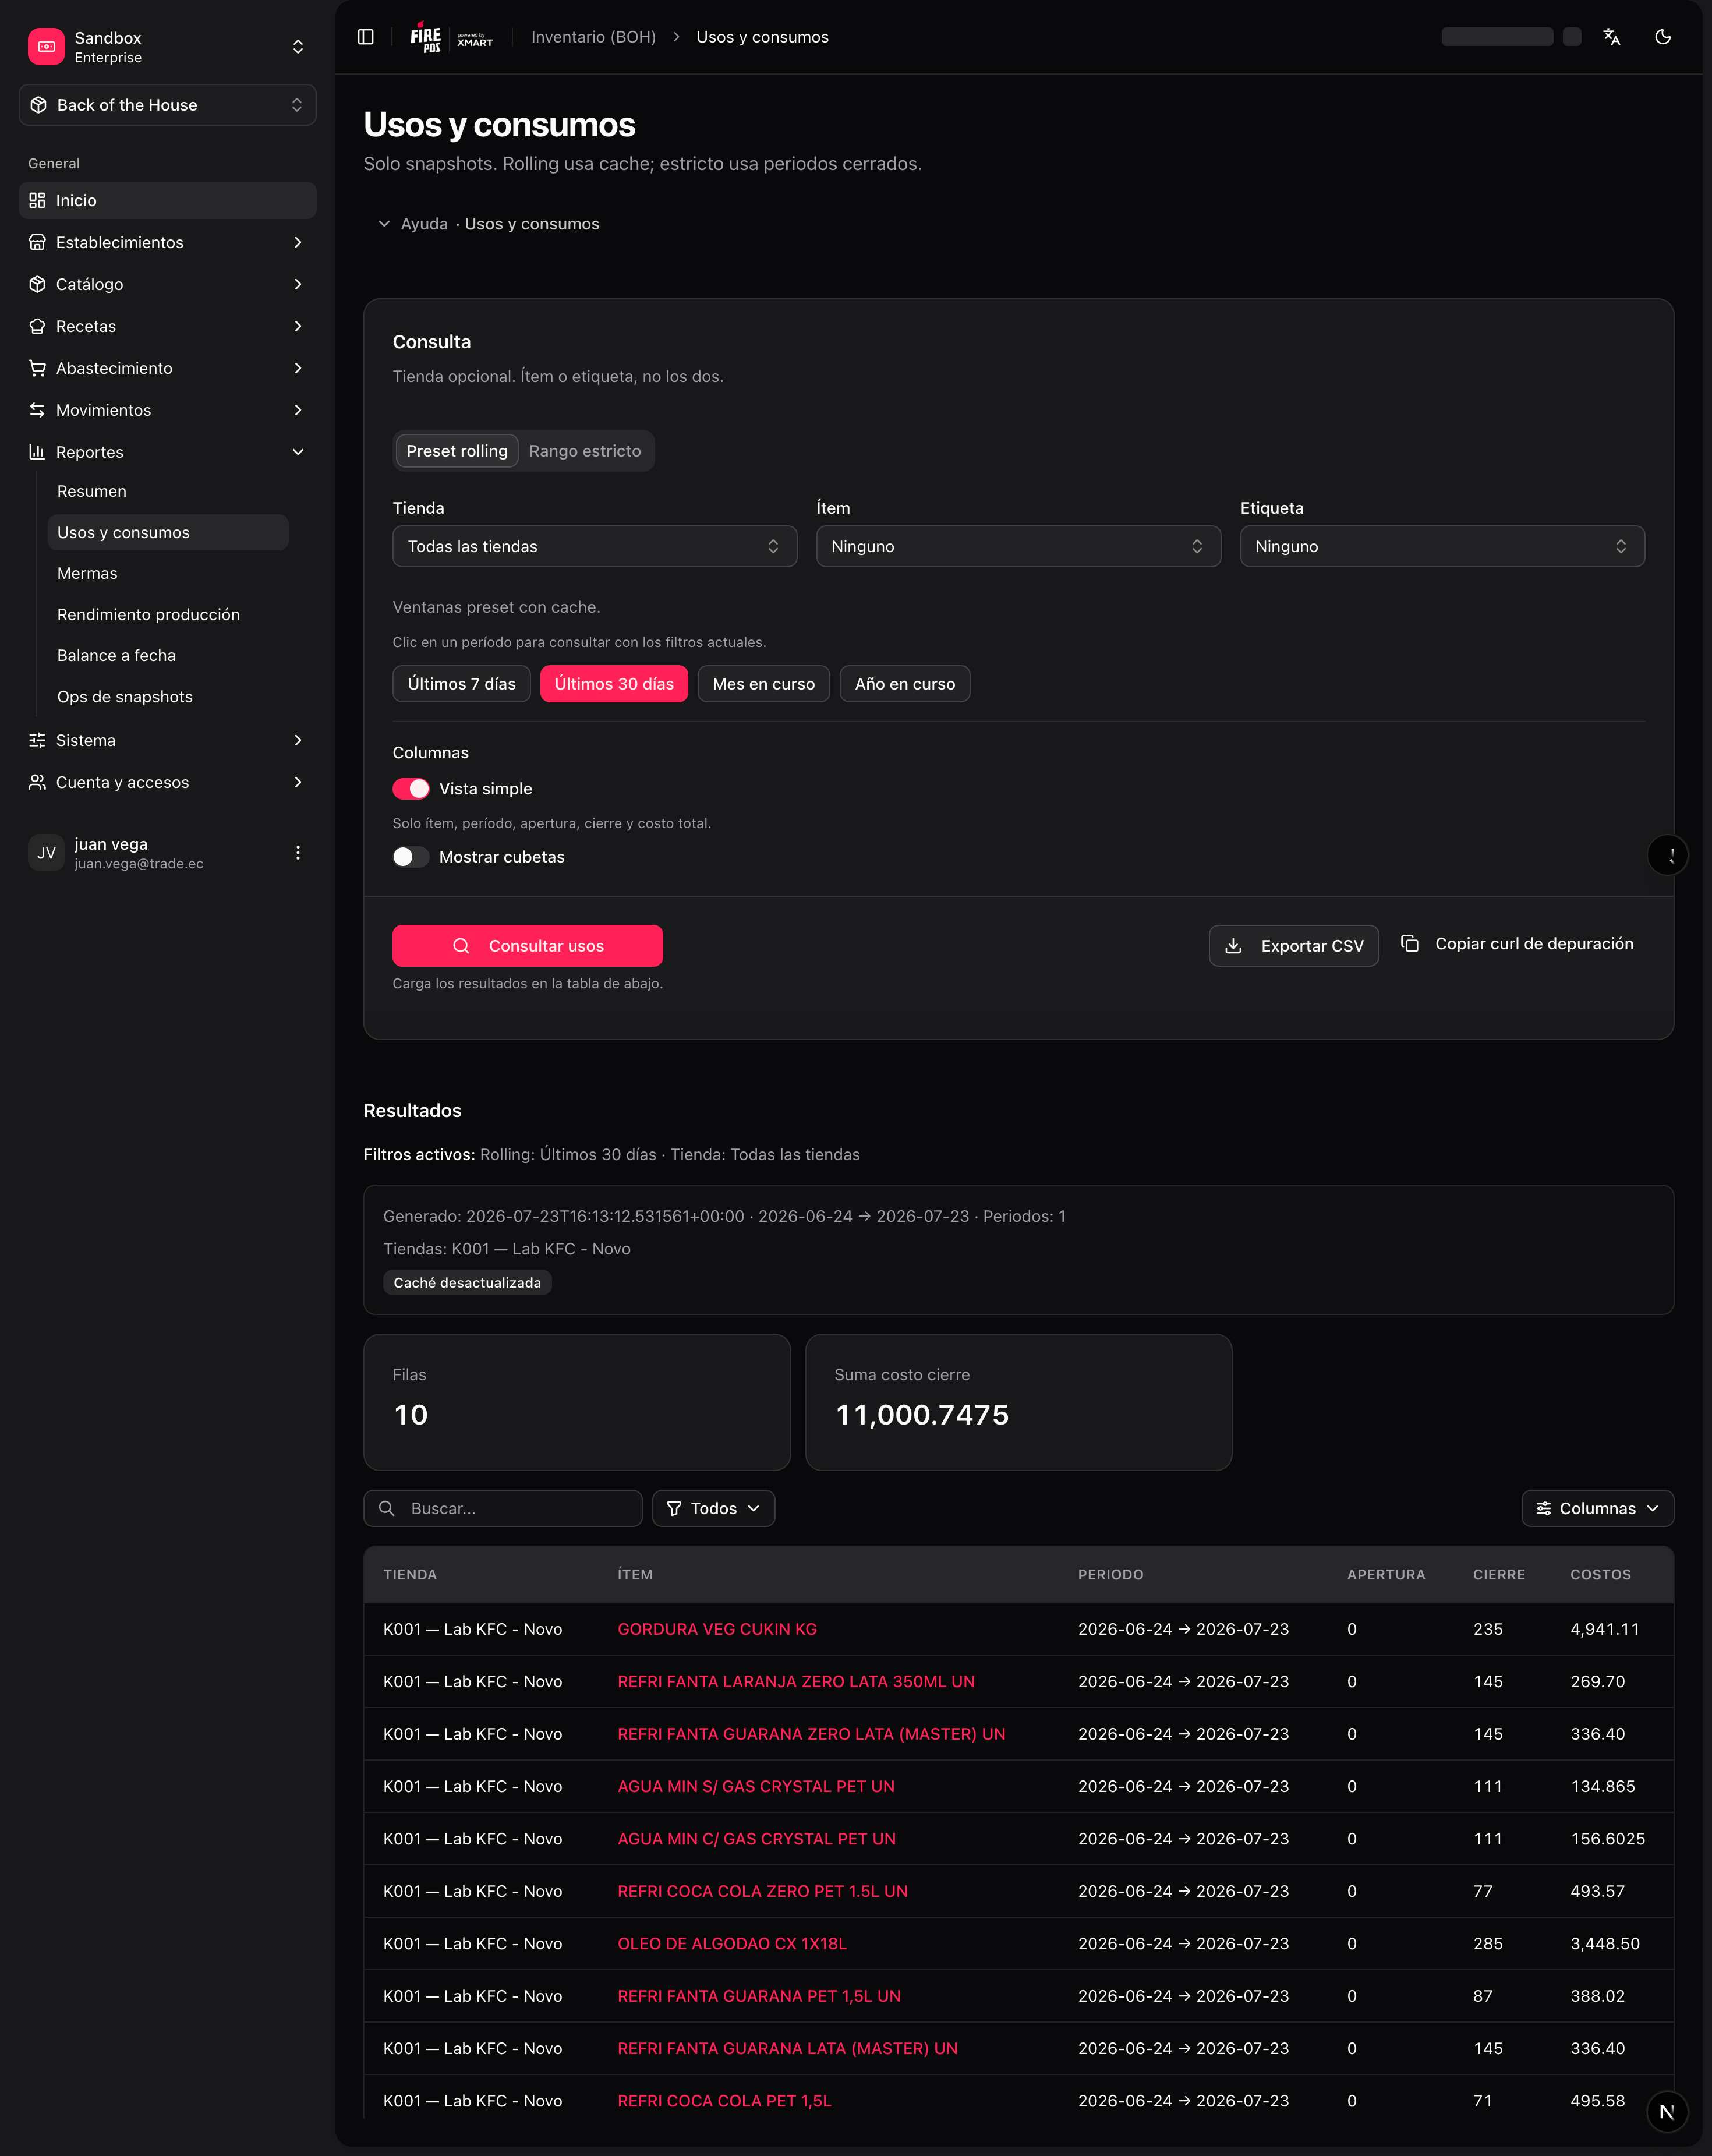
Shows how stock moved over a period, broken down by movement type: receipts, sales consumption, waste, transfers, adjustments, production… Use it to answer "where did my flour go this month?".
**Reports → Usage** (`/boh/admin/reports/inventory/usage`). Supports both fixed date ranges and rolling windows (last 7 days, last 30 days, month to date).
## Usage and consumption
Shows how stock moved over a period, broken down by movement type: receipts, sales consumption, waste, transfers, adjustments, production… Use it to answer "where did my flour go this month?".
**Reports → Usage** (`/boh/admin/reports/inventory/usage`). Supports both fixed date ranges and rolling windows (last 7 days, last 30 days, month to date).
 ## Waste
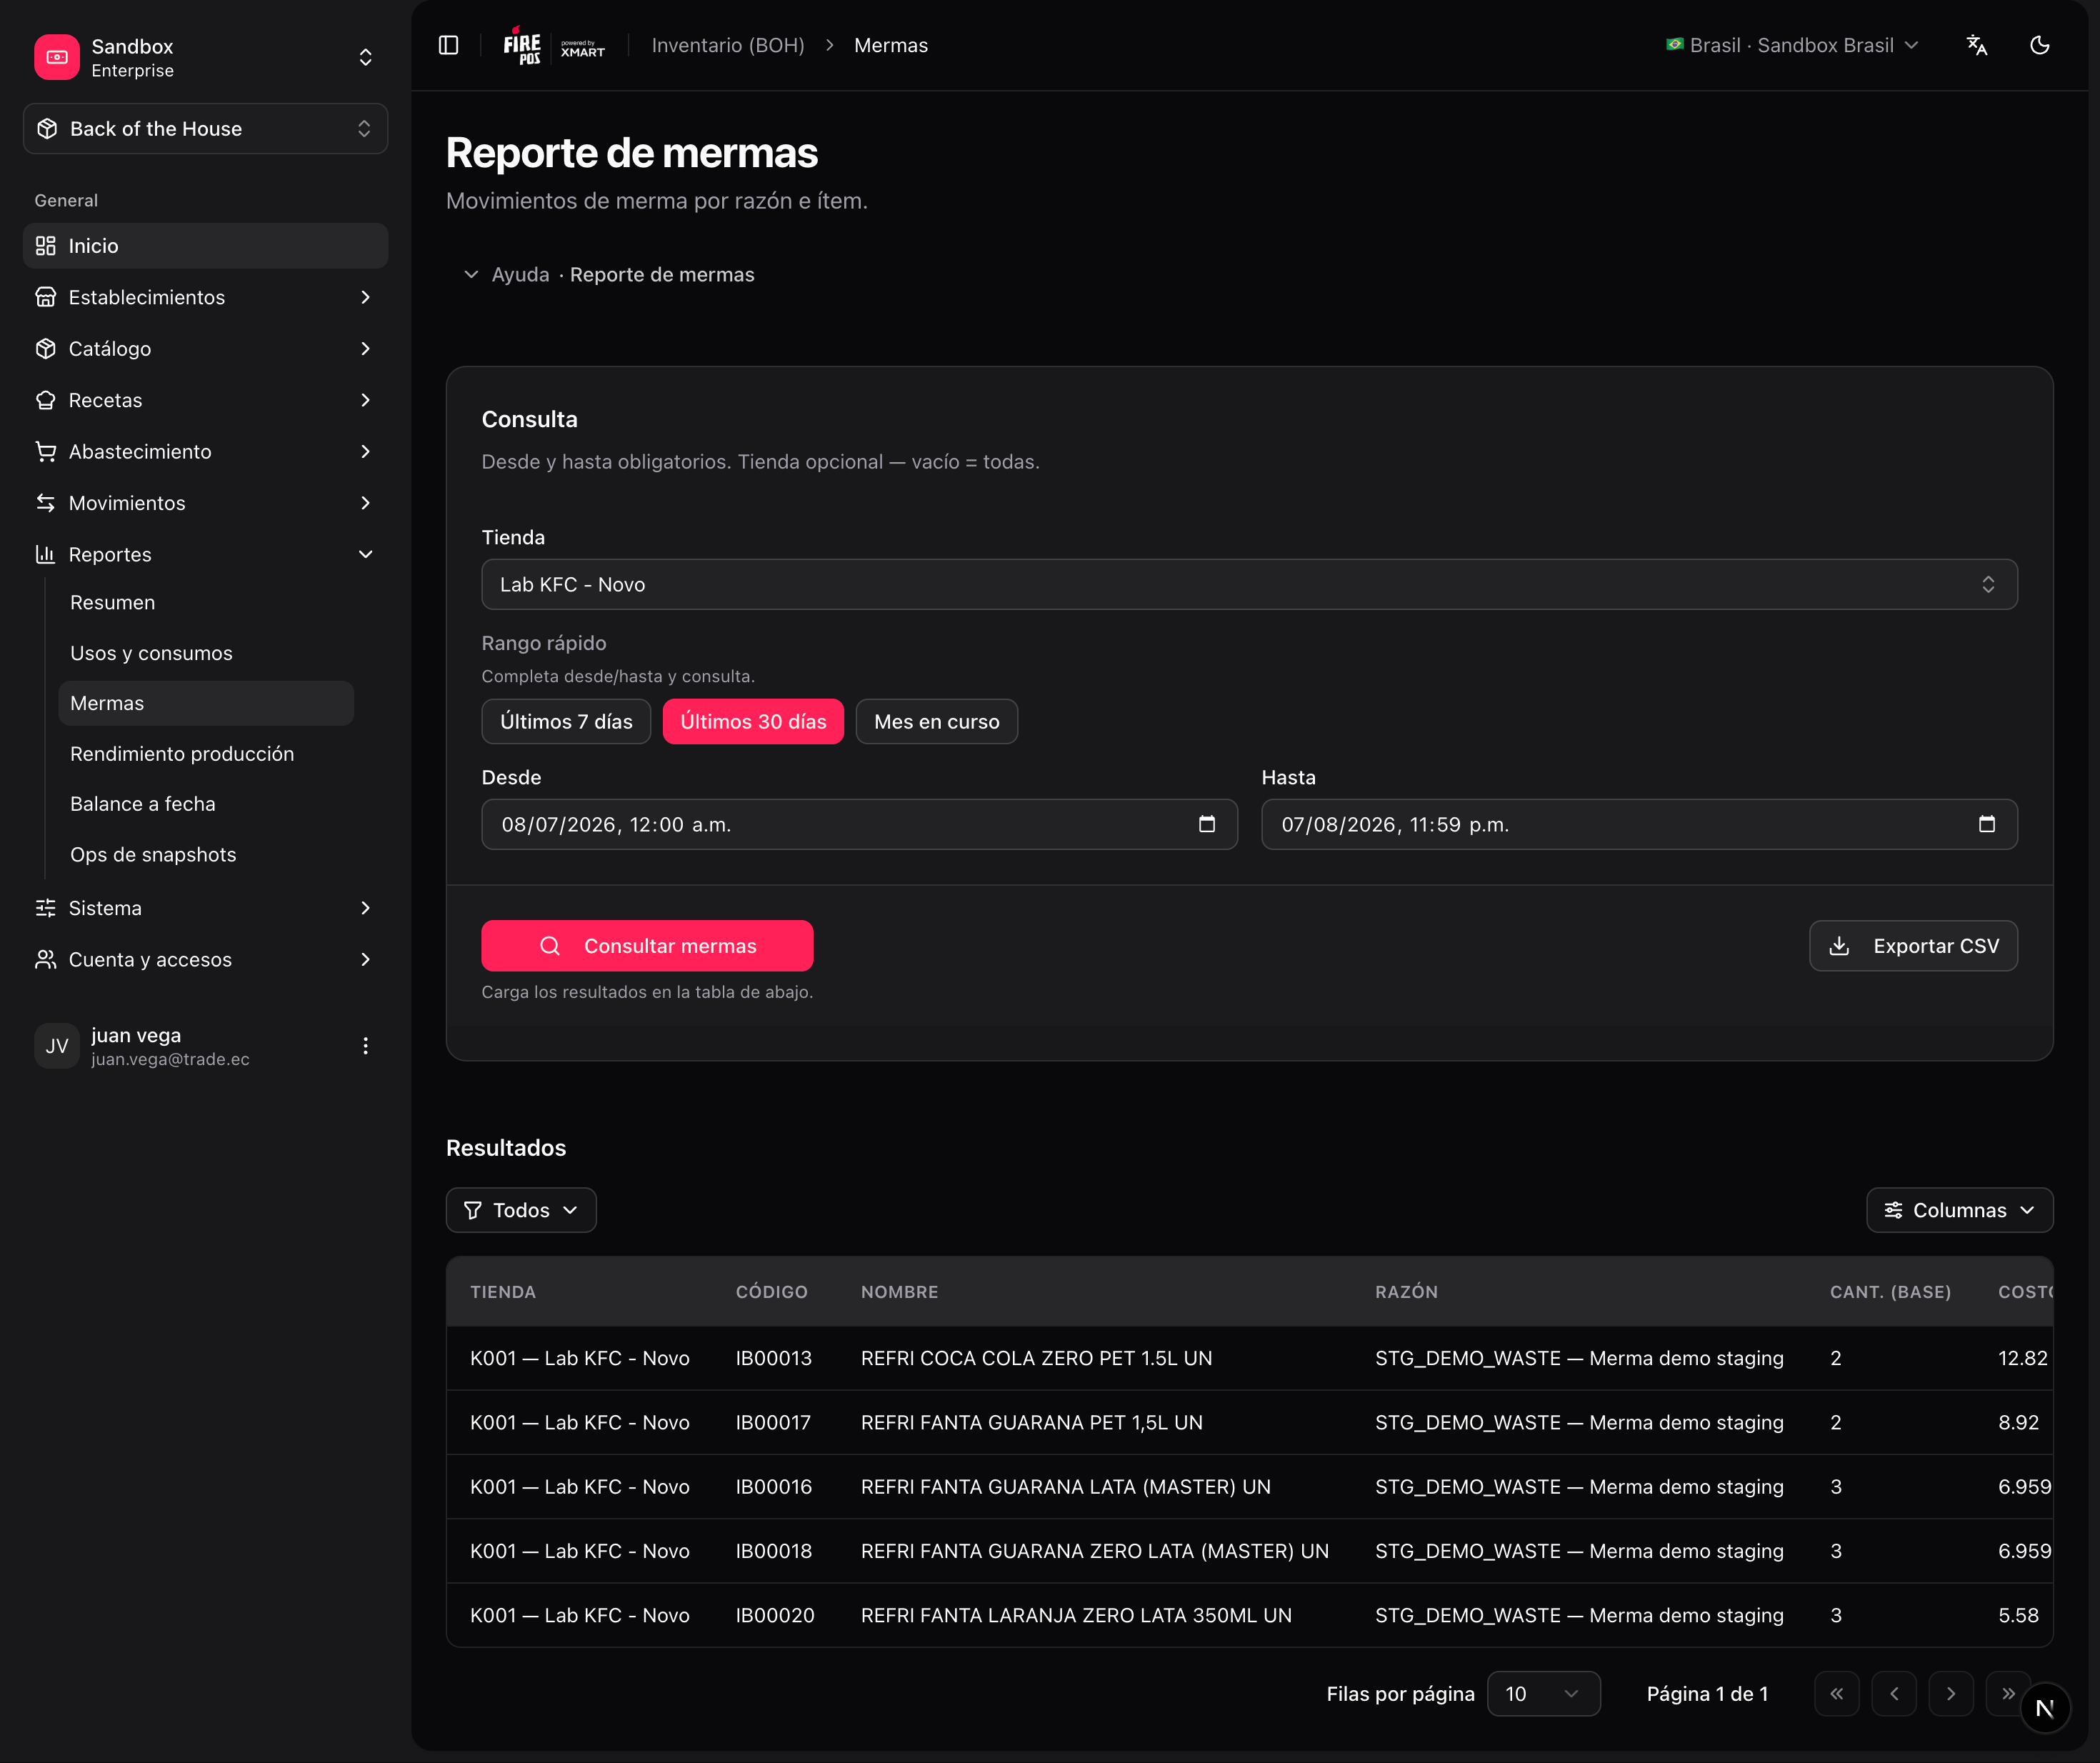
Aggregates [waste events](/en/manuals/boh/waste-consumption) by store, item, and **reason**. The controllable/non-controllable split of reasons makes it easy to separate operational losses (preparation errors) from unavoidable ones (expiry of slow-moving items).
**Reports → Waste** (`/boh/admin/reports/inventory/waste`).
## Waste
Aggregates [waste events](/en/manuals/boh/waste-consumption) by store, item, and **reason**. The controllable/non-controllable split of reasons makes it easy to separate operational losses (preparation errors) from unavoidable ones (expiry of slow-moving items).
**Reports → Waste** (`/boh/admin/reports/inventory/waste`).
 ## Production yield
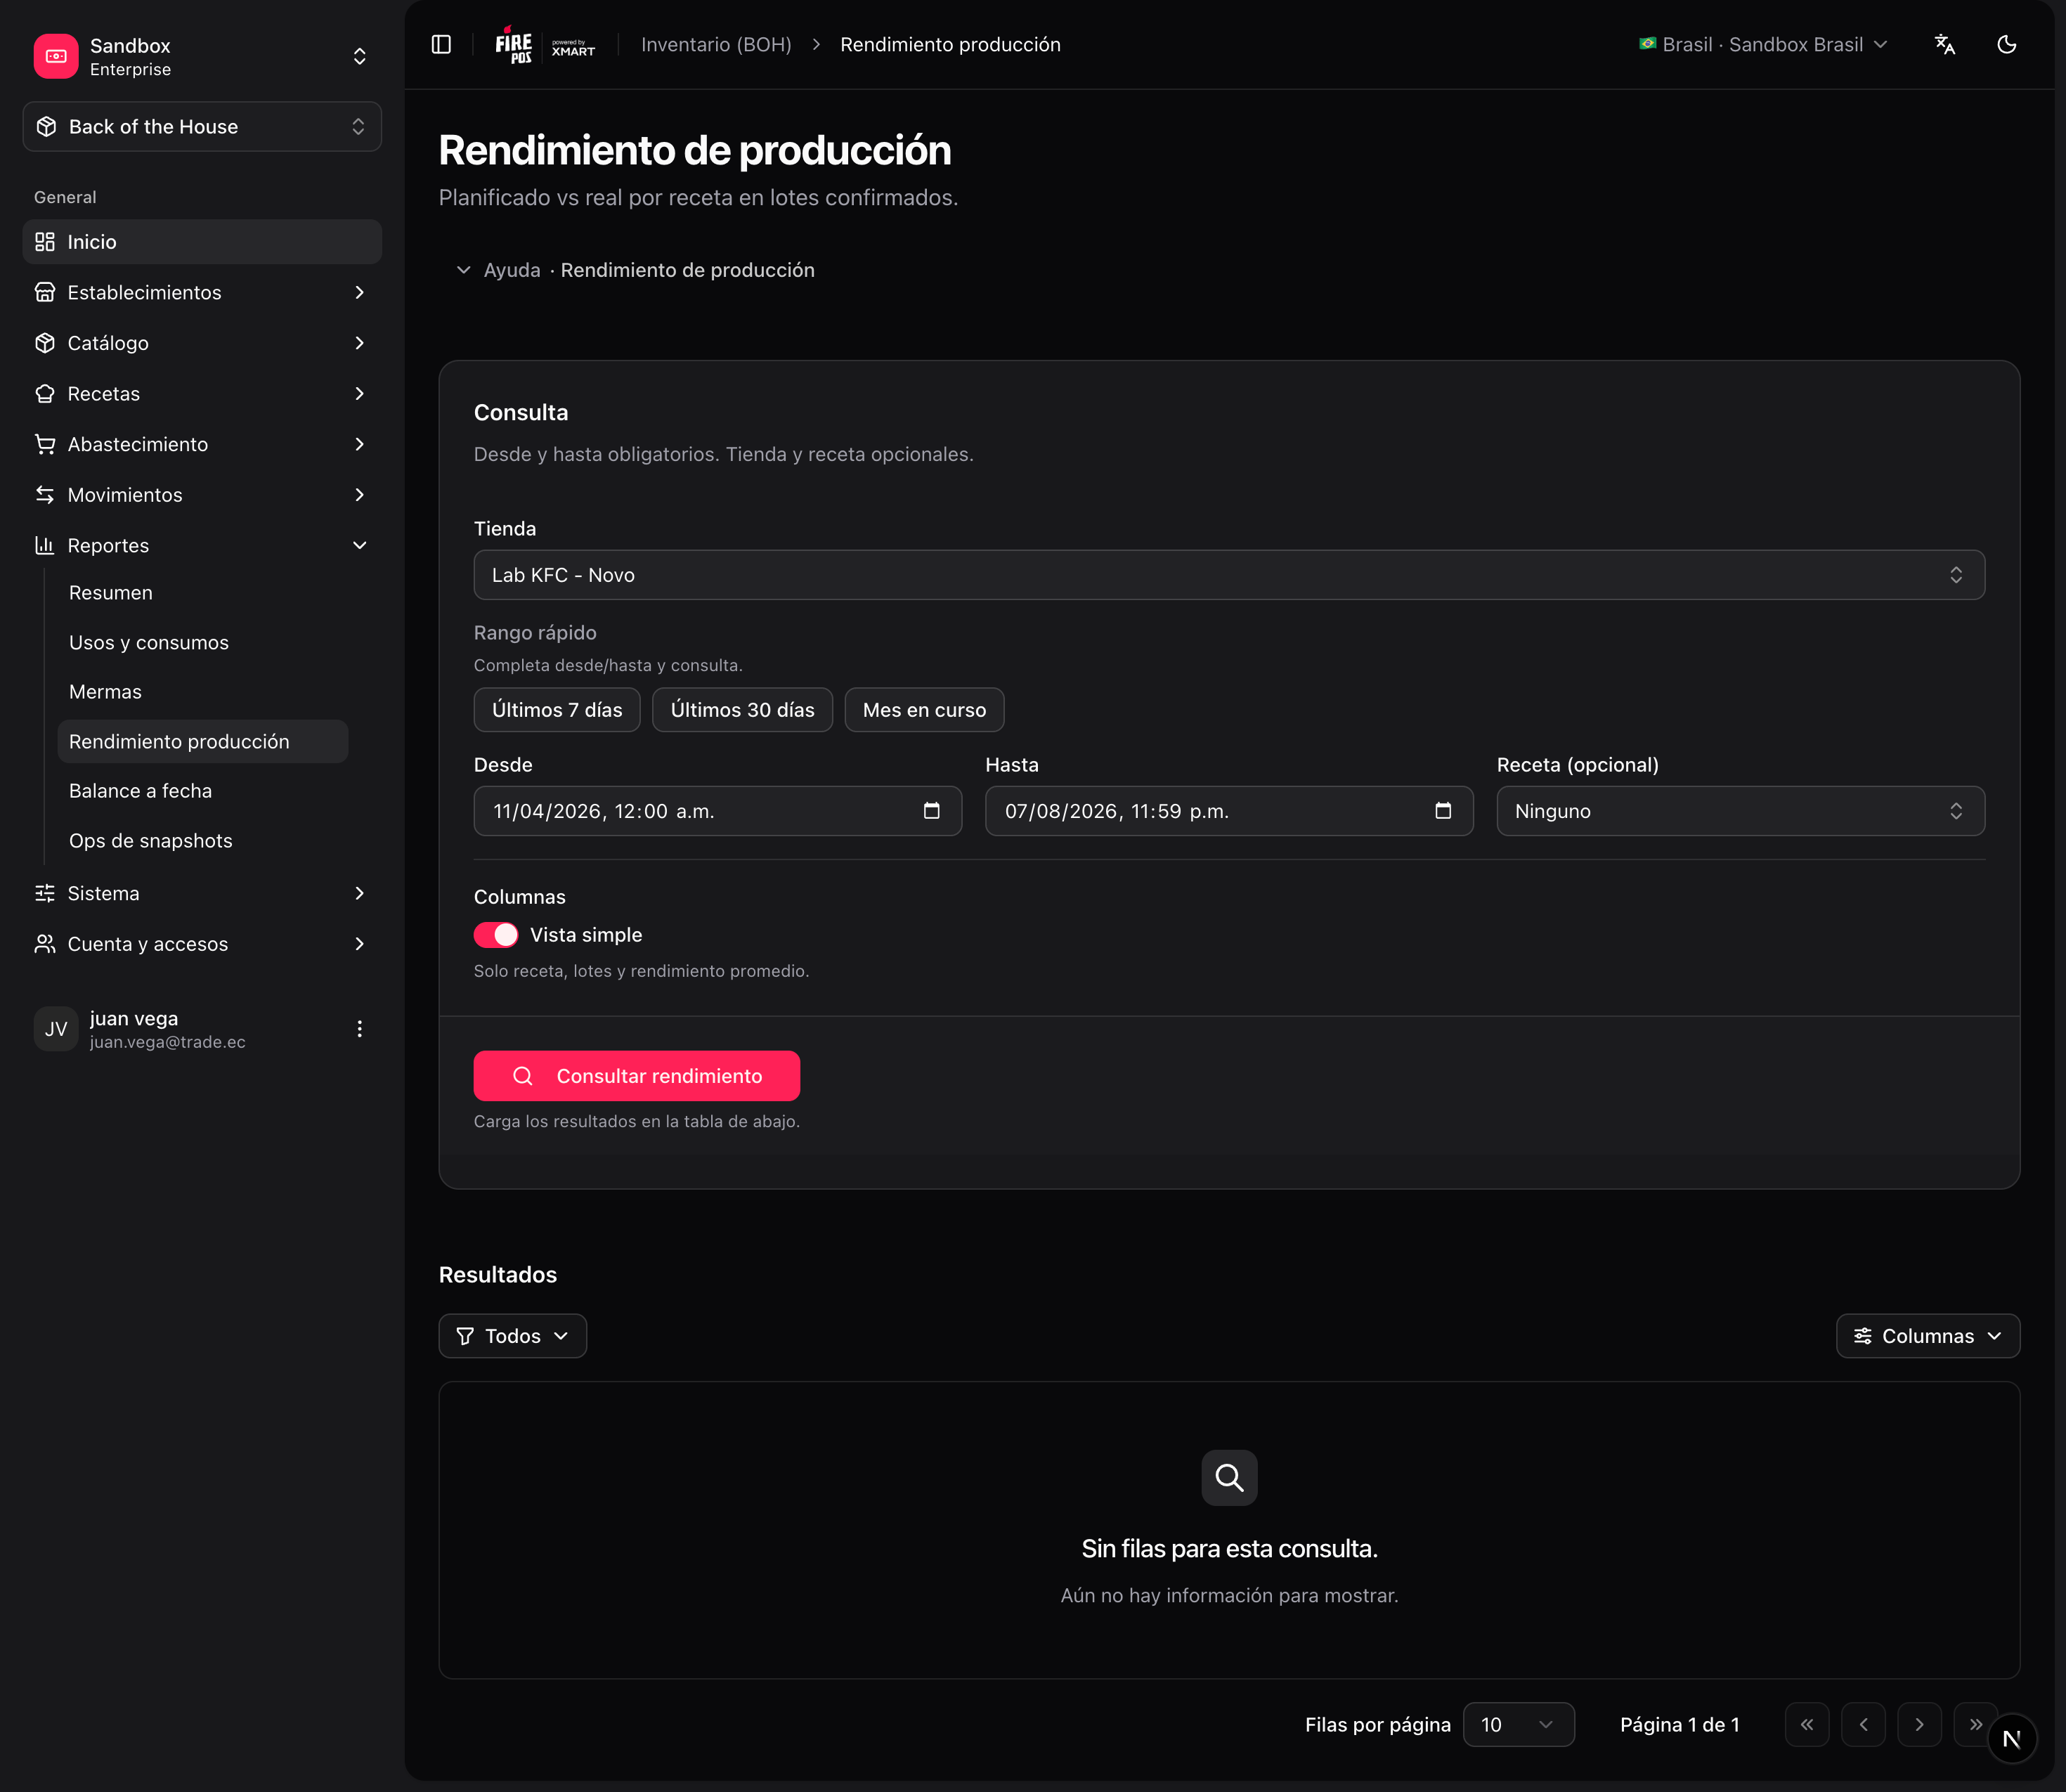
Compares planned versus actual output of [production batches](/en/manuals/boh/transfers-production#production-batches). Consistently low yields point at recipes with optimistic quantities or at process losses.
**Reports → Production yield** (`/boh/admin/reports/inventory/yield`).
## Production yield
Compares planned versus actual output of [production batches](/en/manuals/boh/transfers-production#production-batches). Consistently low yields point at recipes with optimistic quantities or at process losses.
**Reports → Production yield** (`/boh/admin/reports/inventory/yield`).
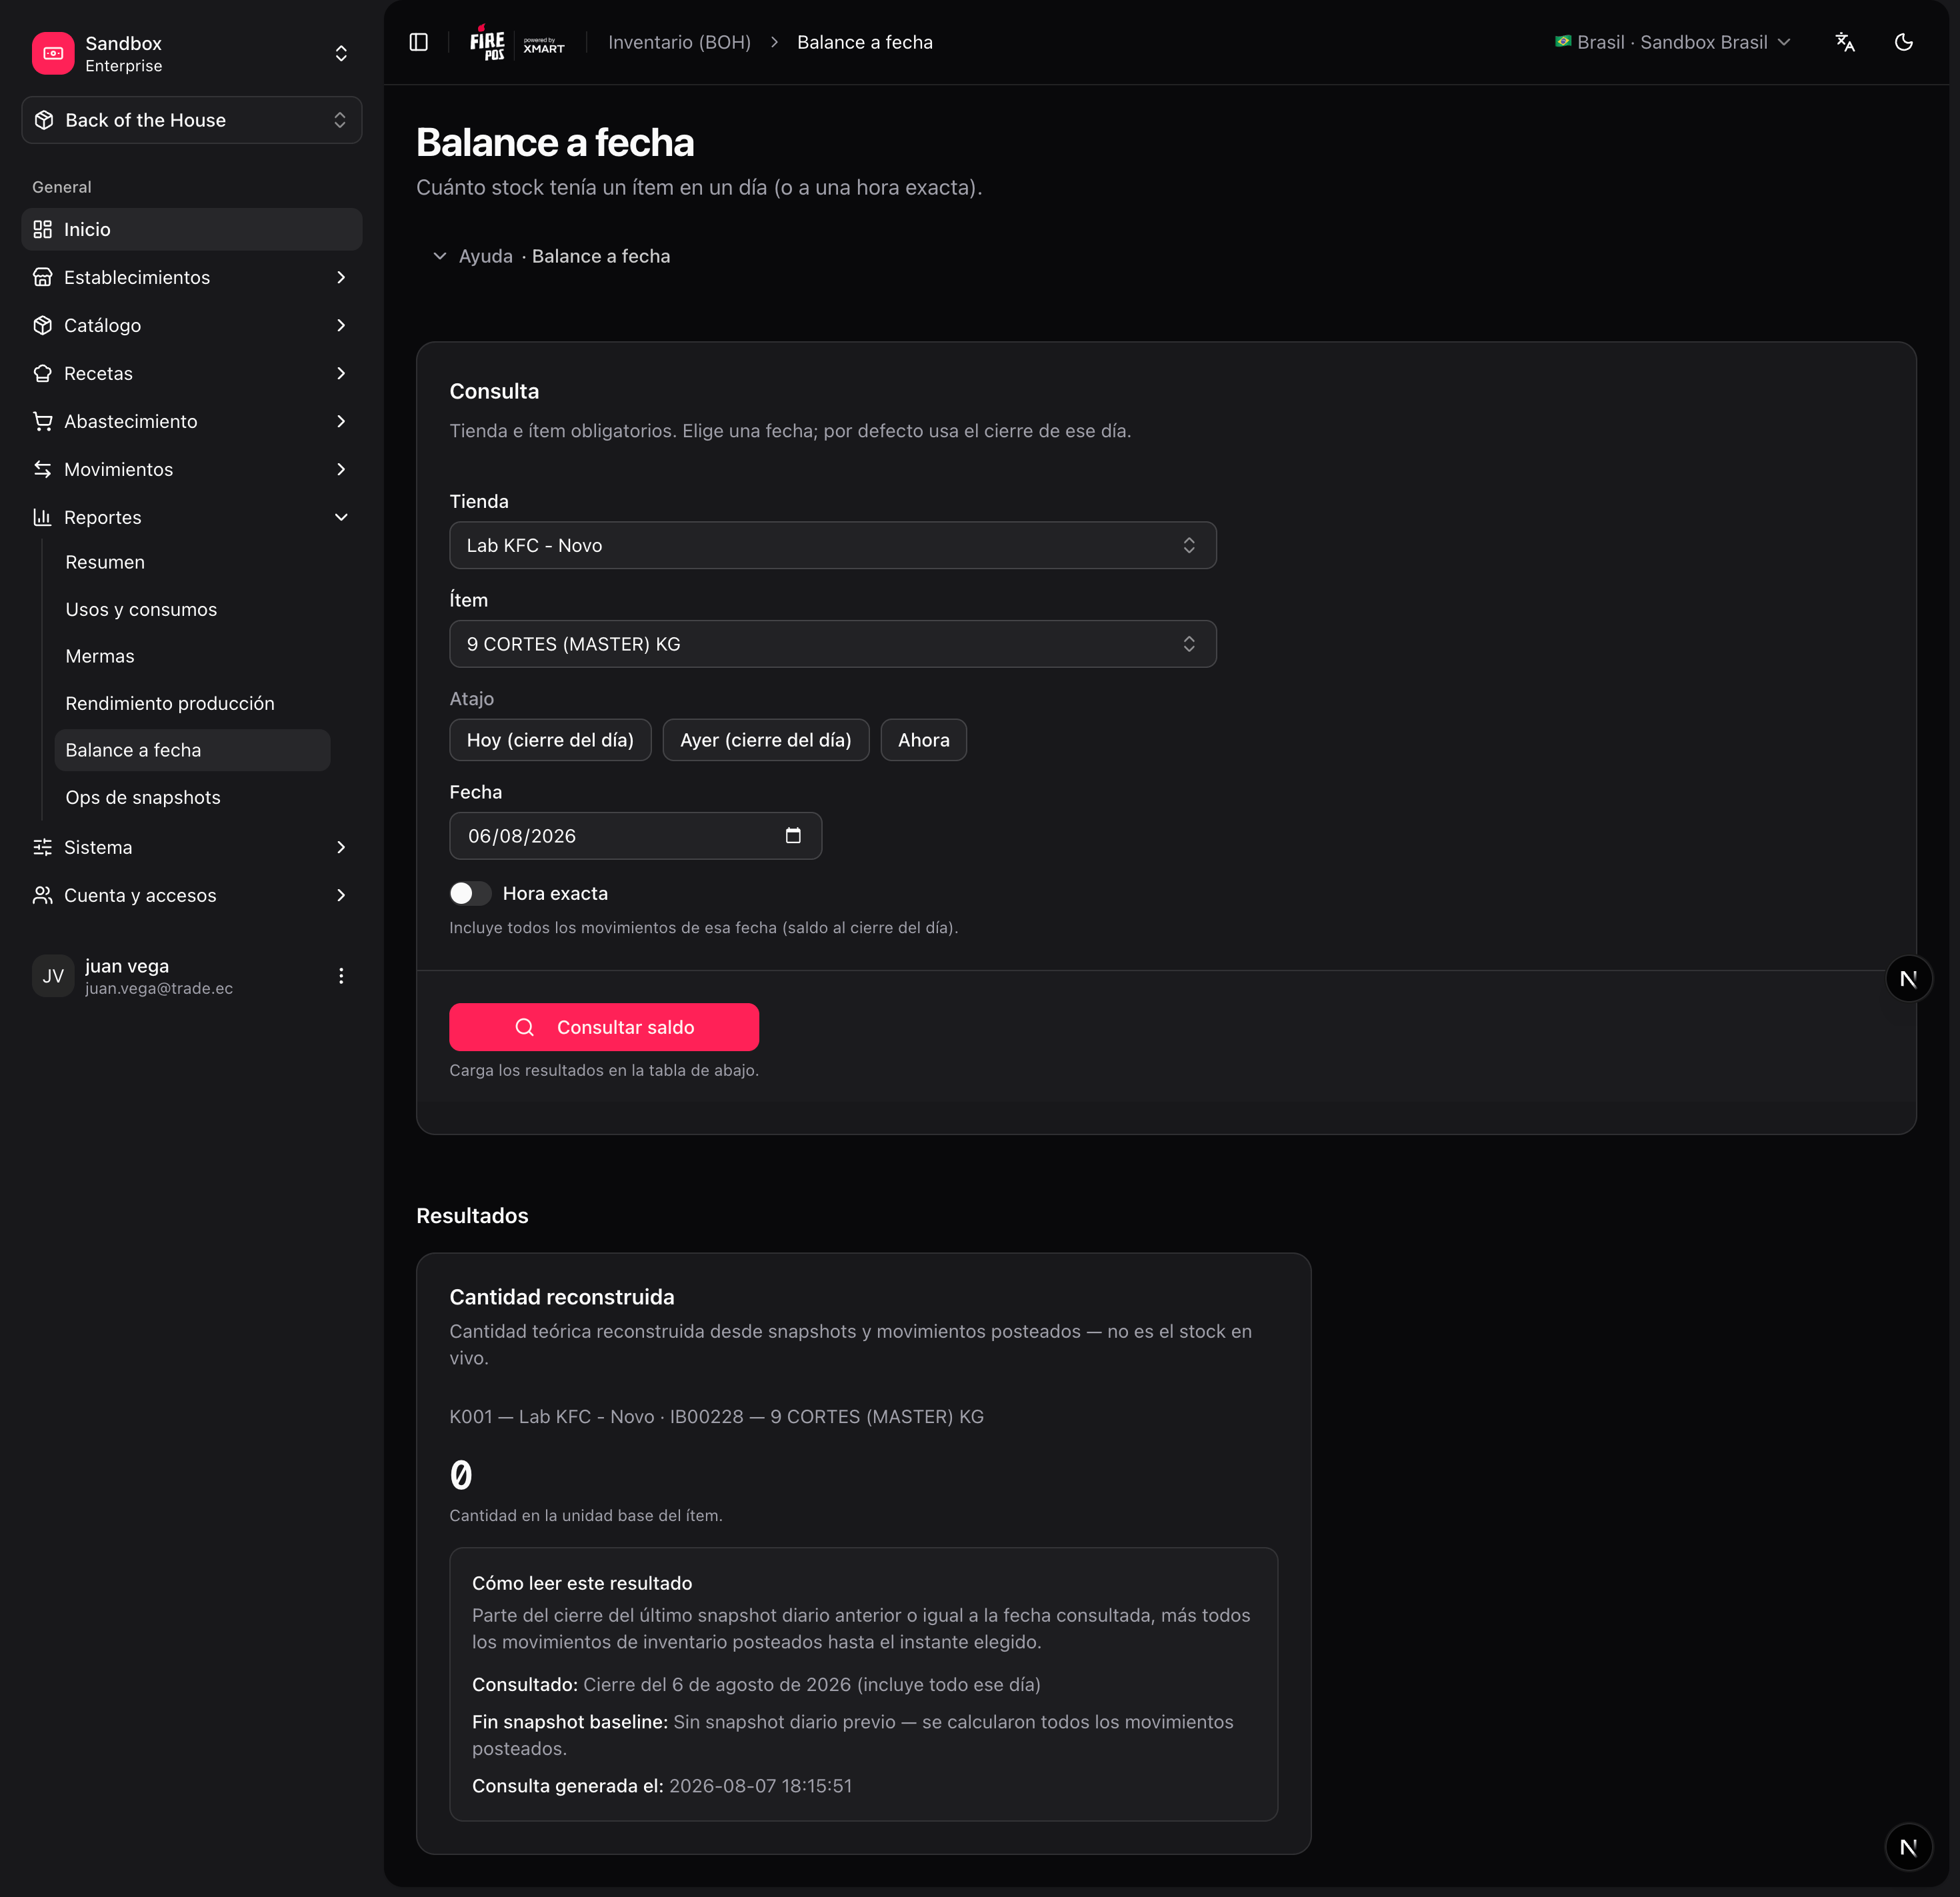
 ## Balance at a date
Reconstructs the stock of any item at a **specific moment in the past** — useful for audits and for investigating differences found in counts ("how much cheese did the system think we had last Sunday night?").
**Reports → Balance at date** (`/boh/admin/reports/inventory/at`).
## Balance at a date
Reconstructs the stock of any item at a **specific moment in the past** — useful for audits and for investigating differences found in counts ("how much cheese did the system think we had last Sunday night?").
**Reports → Balance at date** (`/boh/admin/reports/inventory/at`).
 Reports are built from period snapshots that the system generates automatically. Very recent movements (last few minutes) may take a moment to be reflected.
With reports you close the BOH cycle: catalog describes the stock, documents move it, counts correct it, and reports explain it.
Reports are built from period snapshots that the system generates automatically. Very recent movements (last few minutes) may take a moment to be reflected.
With reports you close the BOH cycle: catalog describes the stock, documents move it, counts correct it, and reports explain it.