

The minimum you need to know
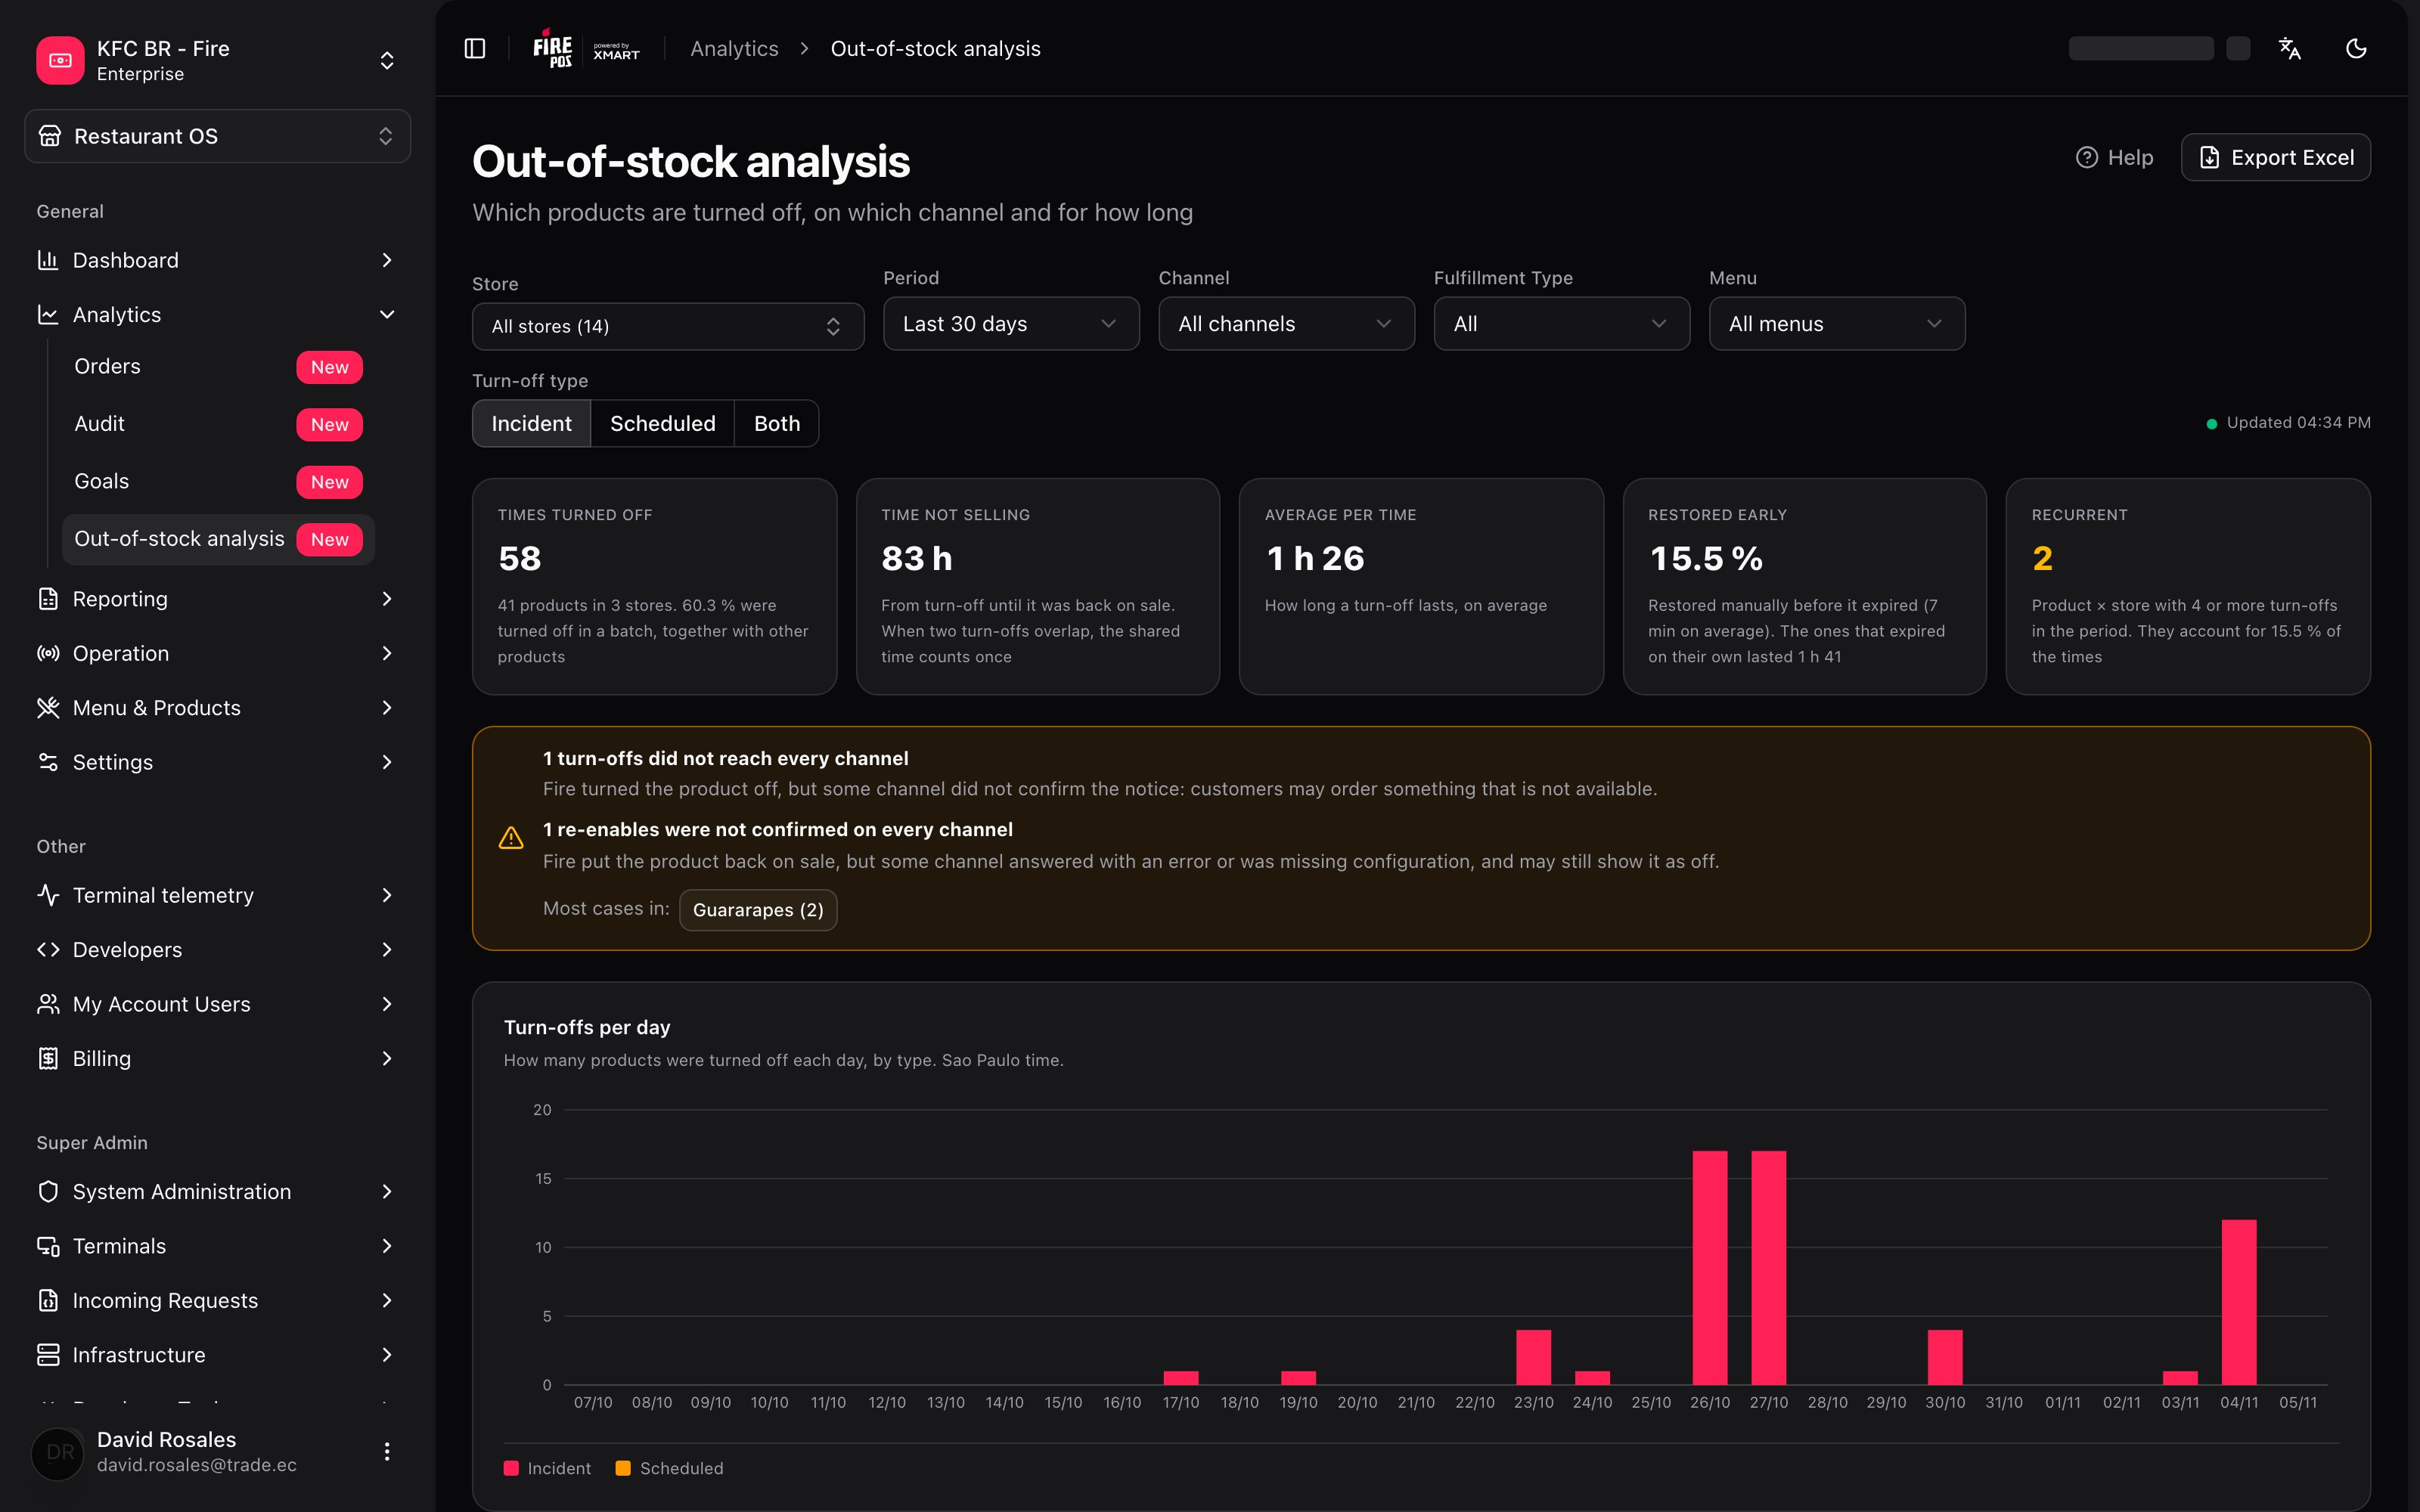
1. It counts turn-offs, not sales. Every time someone turns a product off in Out of stock, a record is created, and this screen counts those records. There are no amounts, currency, taxes or lost sales in any number.2. By default you only see incidents. The Turn-off type filter starts on Incident: long or scheduled turn-offs (for example, “no ice cream until the 30th”) do not appear until you choose Scheduled or Both. It is the number one cause of “I can’t see my turn-off”.3. A turn-off counts on the day it was created. A turn-off that started on Monday and lasts until Wednesday counts once, on Monday.4. The data arrives about 5 minutes late and the screen does not refresh on its own. Change a filter or reopen it to see the latest.5. You only see your stores. If your user is limited to some stores, “All” means “all of yours”, on screen and in the Excel.
The simple path
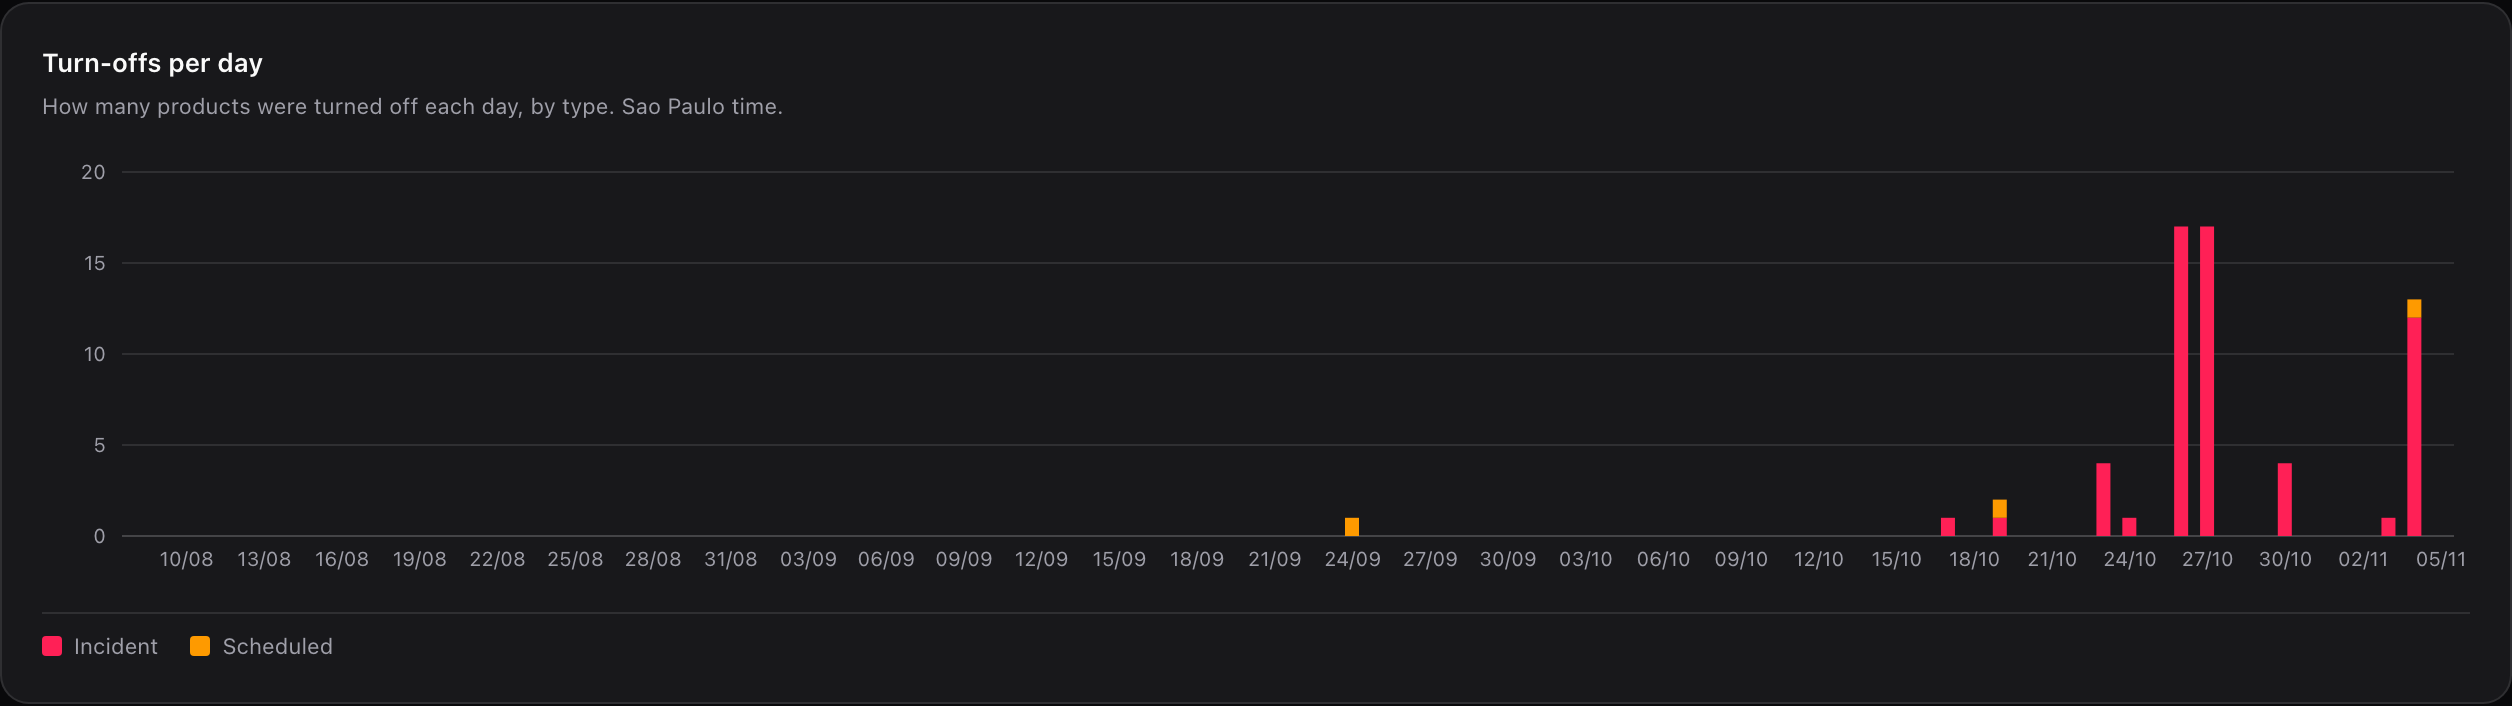
You want to know how your stores did this month:- Pick the account and the country in the Backoffice header.
- Leave Period on Last 30 days and Turn-off type on Incident.
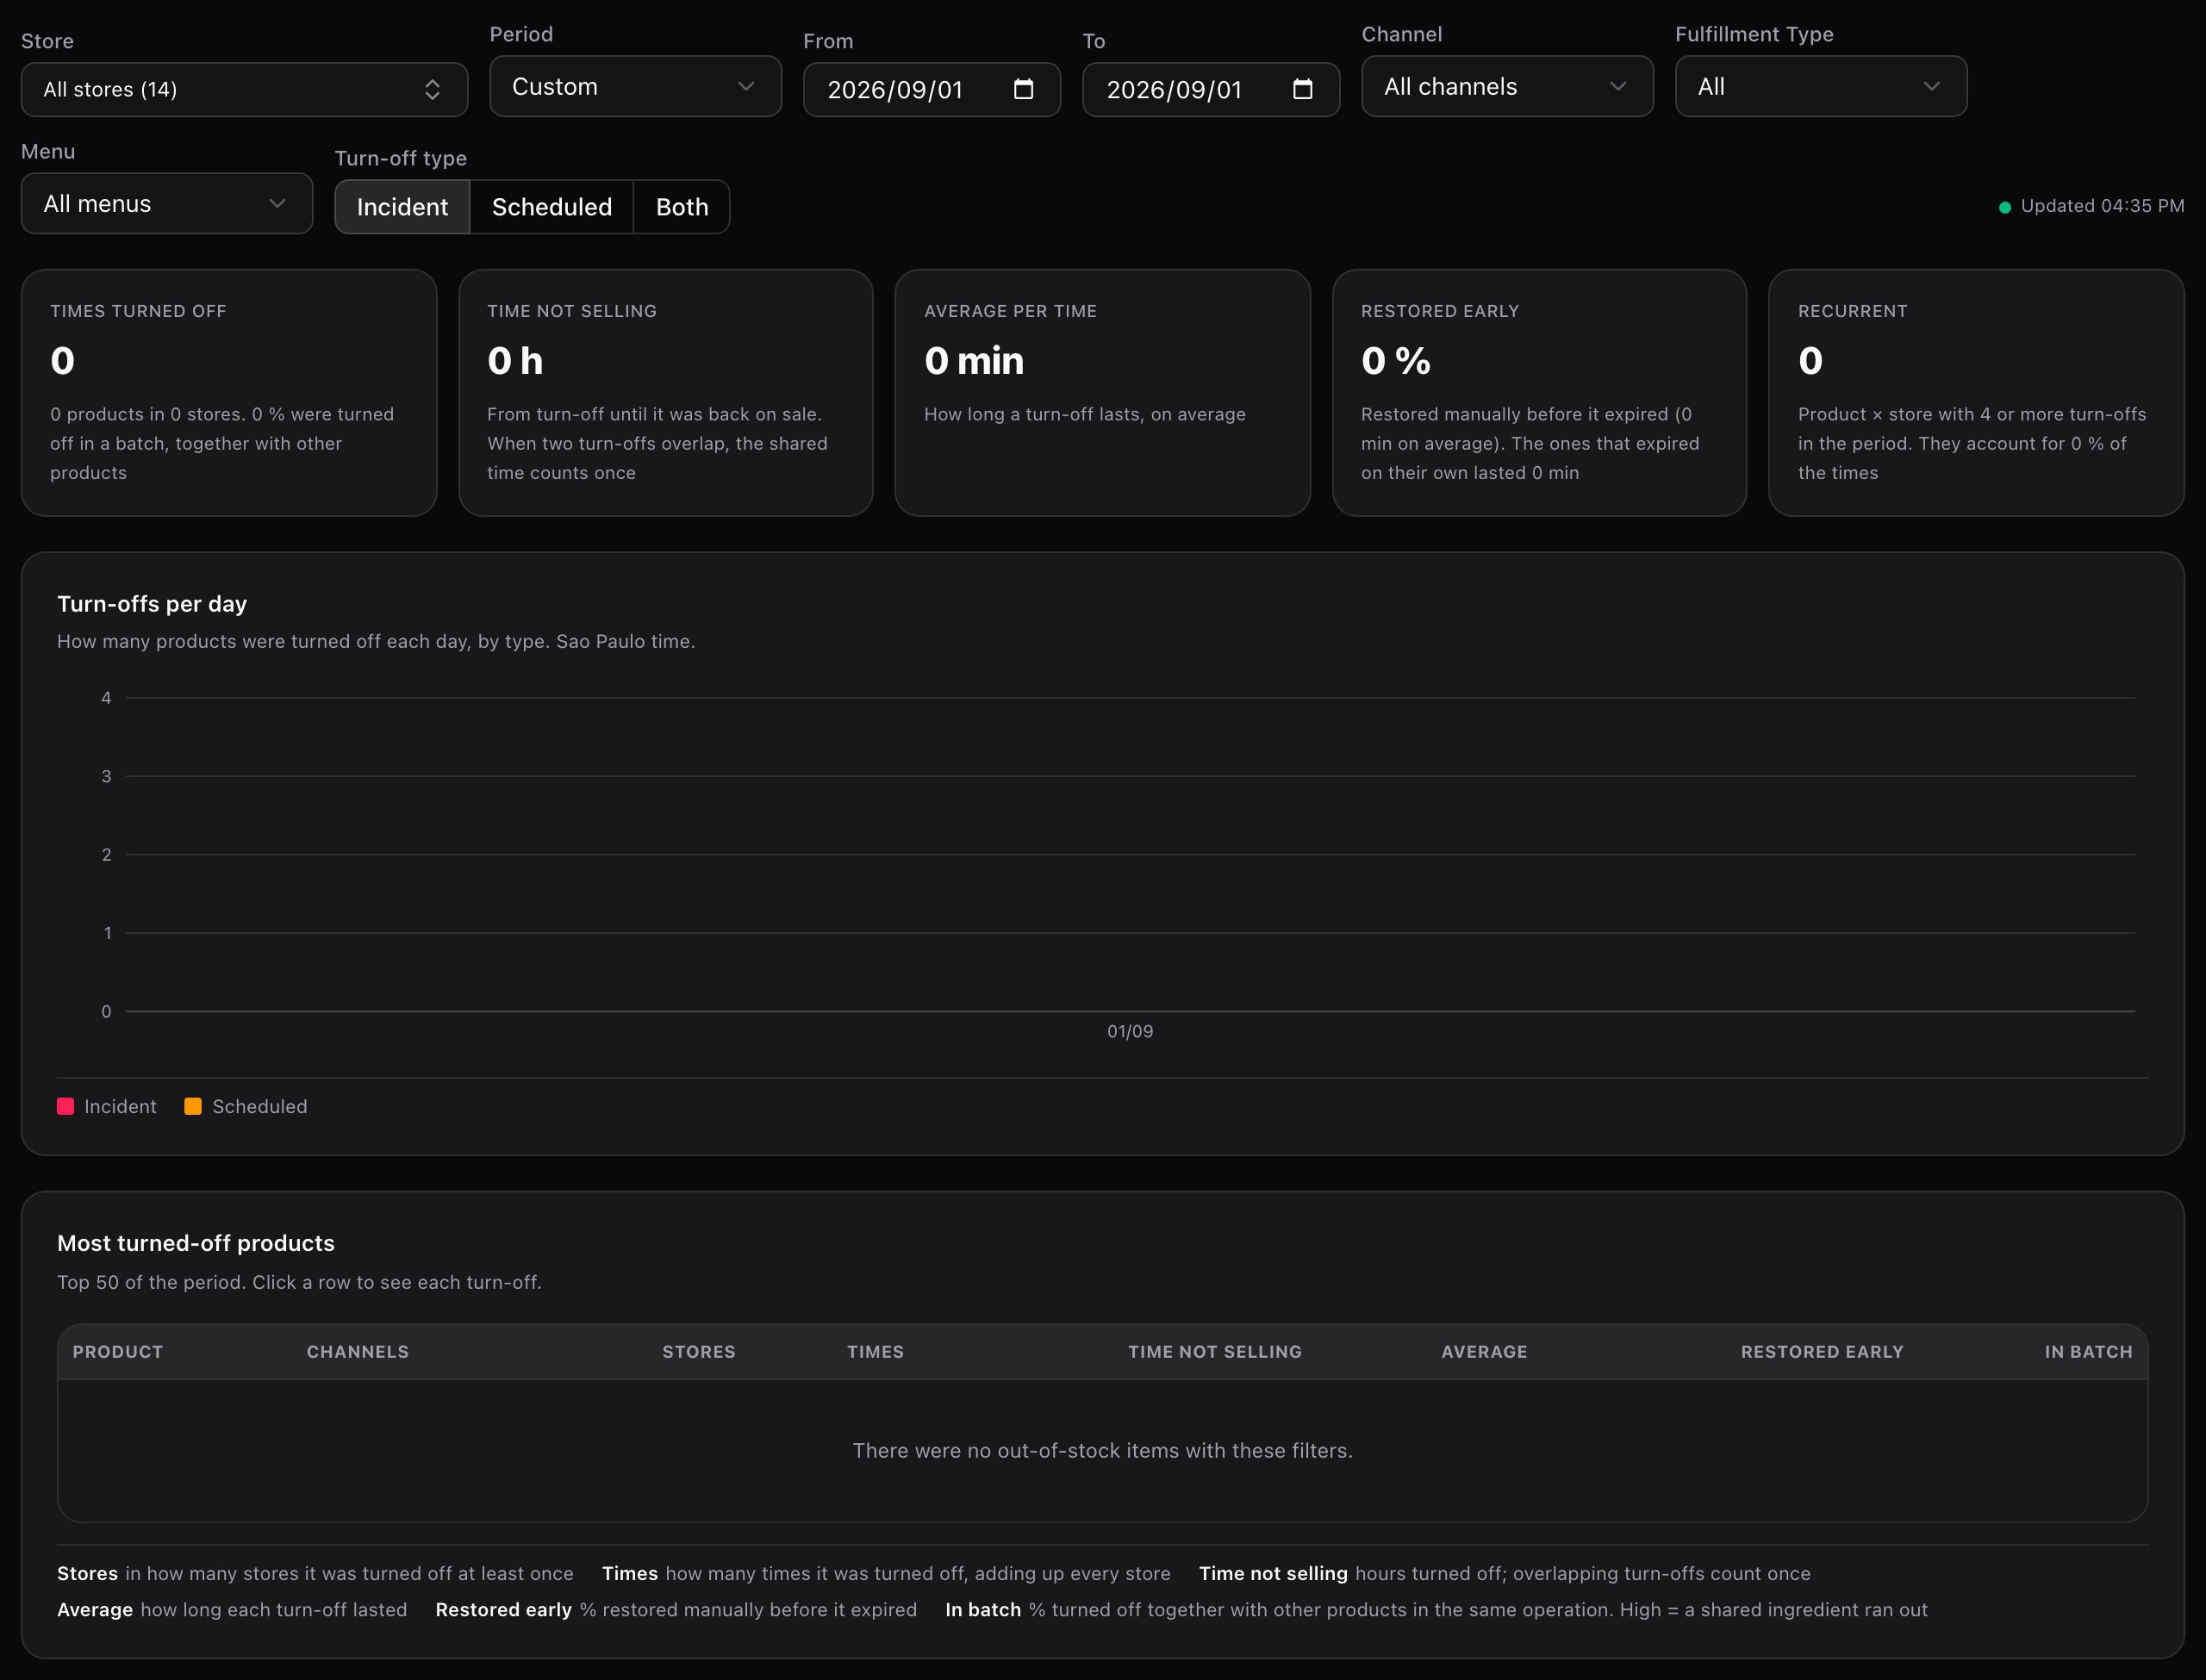
- Read the five cards at the top and the Most turned-off products table.
- To see each turn-off of a product, click its row.
The filters

- The fixed periods end today and include today. “Today” is the day of the chosen store or, if none is chosen, of the most common time zone among your stores. With Custom, From and To appear.
- The maximum range is 92 days, counting both ends.
- Everything you see (cards, chart, tables, side panel and Excel) uses exactly the same filters.
- Changing the account or the country clears Store, Channel and Menu. It does not clear Period, Fulfillment Type or Turn-off type.
Incident, Scheduled and Both
When a turn-off is created, Fire classifies it by when it expires:- Incident: it expires within the store’s operational day on which it was created. Something ran out mid-service and was solved the same day.
- Scheduled: it expires after that day’s closing. It is a planned, multi-day turn-off.
Channel, Fulfillment Type and Menu
These three filters use what the store had assigned at the moment of the turn-off, not today’s assignment. If you reassigned a menu last week, old turn-offs stay under the previous menu.The five cards

If a turn-off is still active, it is counted up to now: the same filter gives more hours a while later.
Turn-offs per day
Most turned-off products
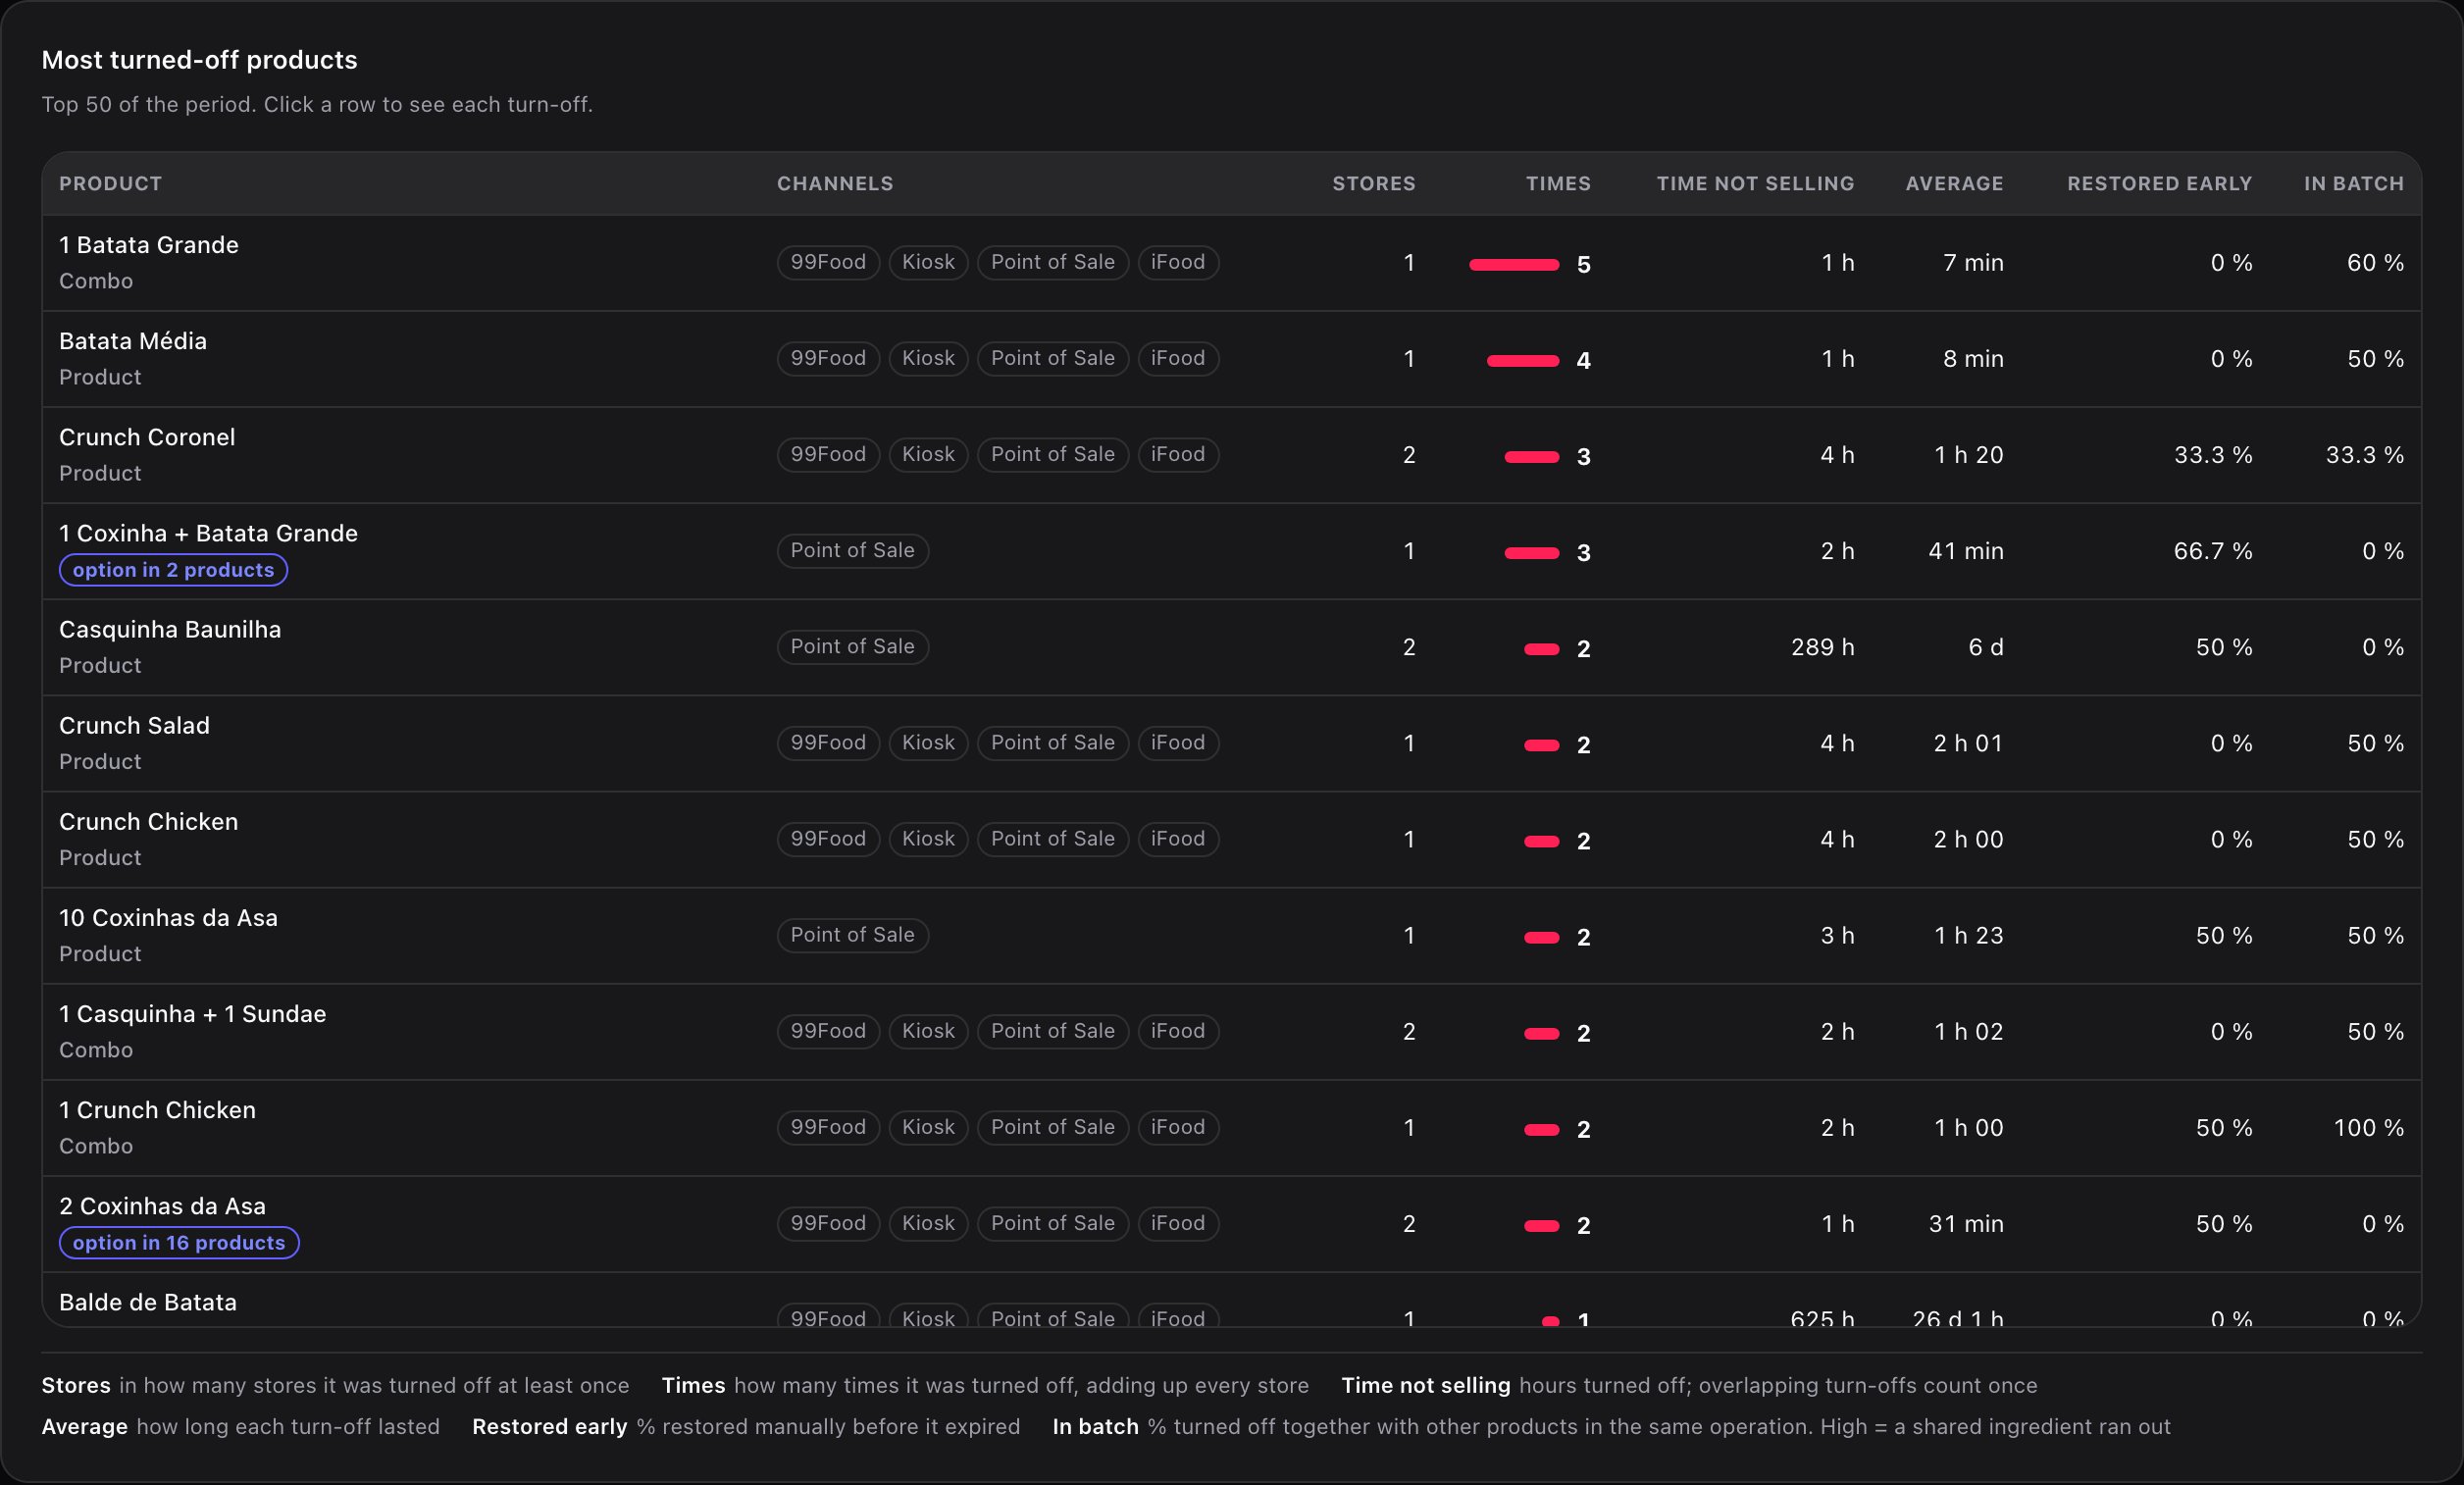
How to read In batch. A high value almost always means a shared ingredient ran out: when the combo boxes run out, every product that uses them is turned off. The problem is then the ingredient, not each product.
What “option in N products” means. The product is not sold on its own in any menu: it only appears as an option inside combos or other products. N is in how many distinct products it appears.
Recurrent out-of-stock items: the list to act on

Stores that turn off the most and the hour map
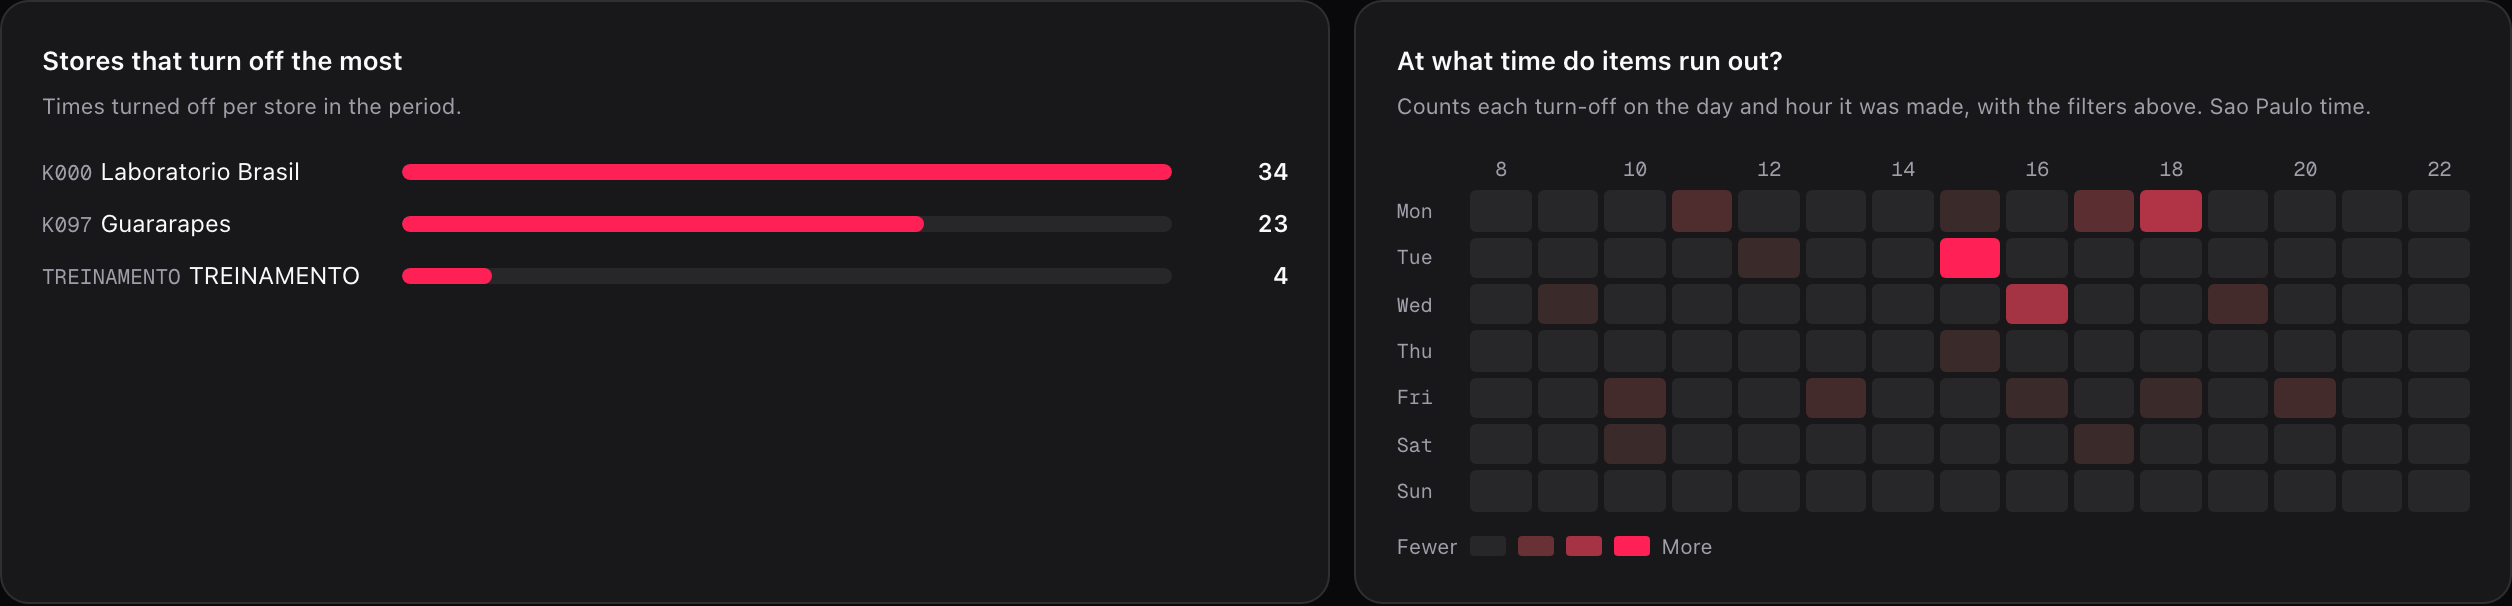
- Stores that turn off the most: times turned off per store. The first 10 are shown.
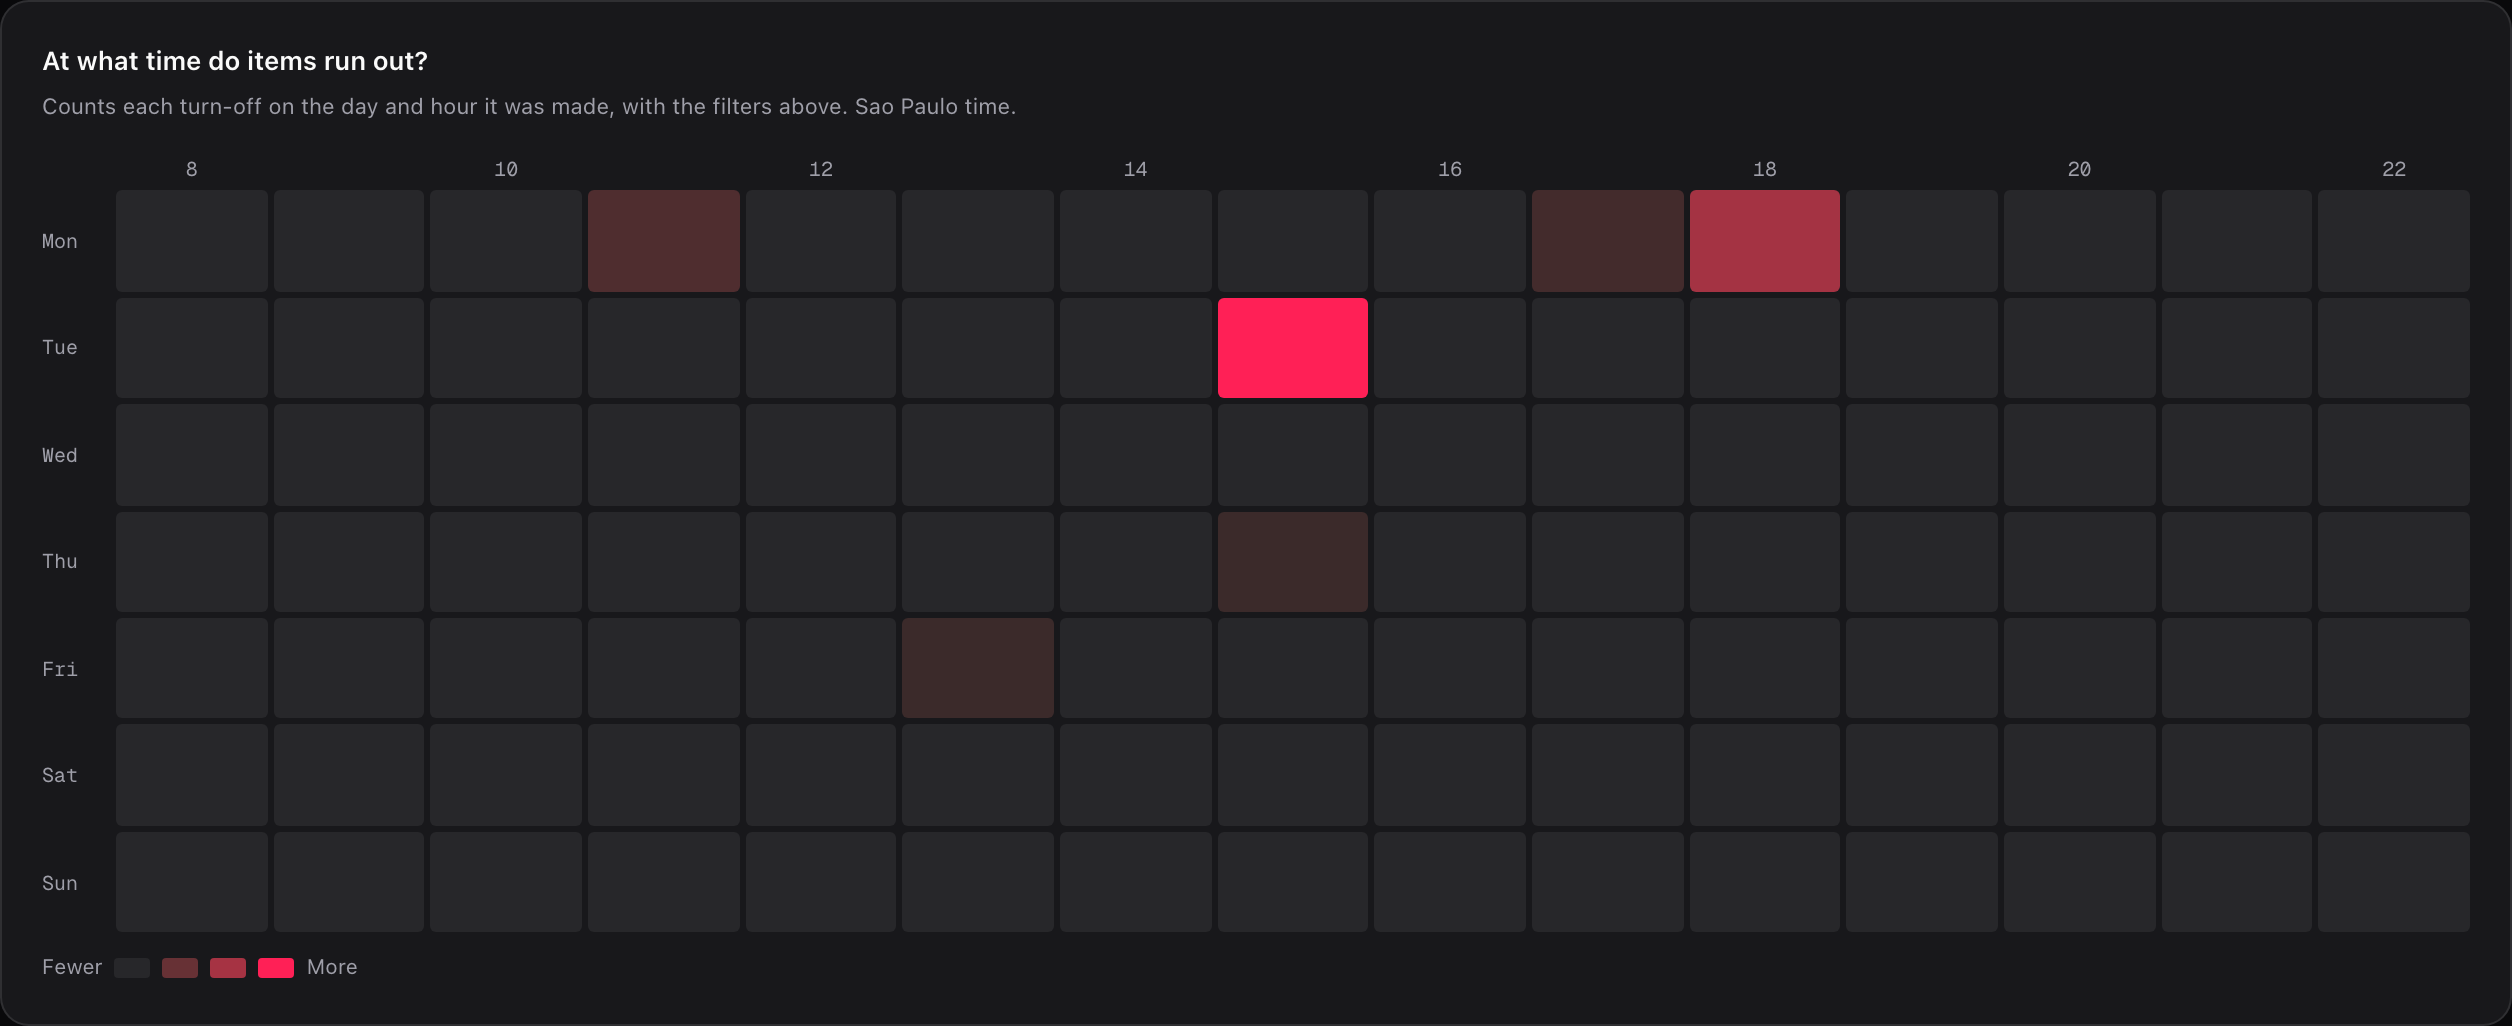
- At what time do items run out?: a heat map of weekday by hour (Monday on top). It counts each turn-off on the day and hour it was created. Columns run from 8 to 22 h and widen if there are turn-offs outside that range.
A product’s panel
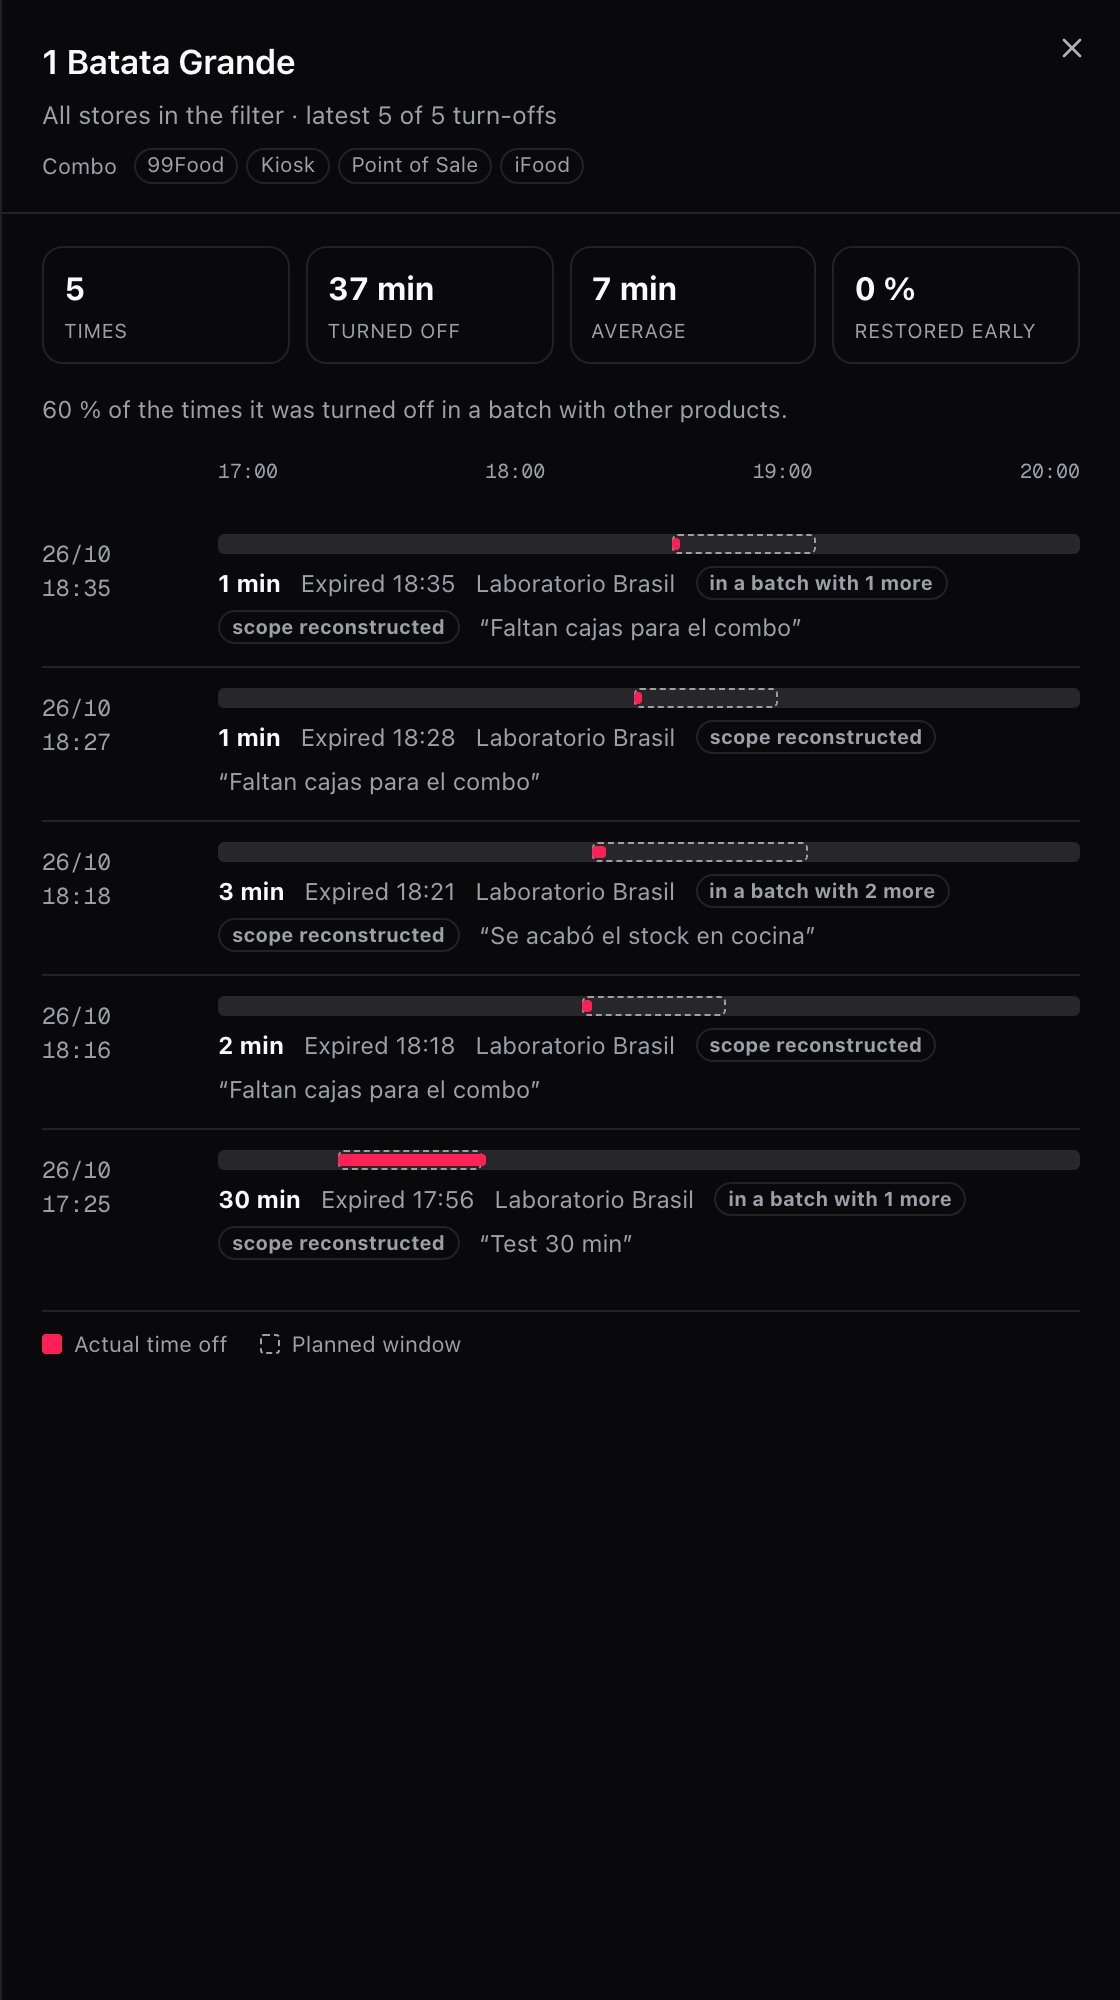
- Four mini cards: Times, Turned off, Average and Restored early.
- One line per turn-off, newest first, 20 at a time with Load more. Each line shows the date and time, a bar with the actual time (filled) over the planned window (dashed), the duration, how it ended, the store and the reason written by whoever turned it off.
The timeline uses a single-day axis. A turn-off that crosses midnight is cut at the end of the axis.
When a channel did not get the word
When a product is turned off or back on, Fire notifies every channel. If a notice was not confirmed, an amber strip appears above the tables. It only appears when there are cases.- Turn-offs that did not reach all channels: Fire turned the product off, but a channel did not confirm. The customer may order something that is not there.
- Turn-ons that were not confirmed: Fire put the product back on sale, but a channel answered with an error or was missing configuration. The product may keep showing as off when there is already stock.

It is not a failure when a notice was not sent because another turn-off already had that product turned off. Those cases do not count in the strip.
The turn-off not confirmed part can only appear on turn-offs created after this screen launched: that result was not stored before. The turn-on not confirmed part also applies to earlier turn-offs.
Export to Excel
The Export Excel button (top right) downloadsagotados_<from>_<to>.xlsx with the same filters you see. While it is generating it says Generating….
- Hours are a number with 2 decimals, so you can add them up.
- Dates are
YYYY-MM-DD HH:mm, in the screen’s time zone. - If the detail goes over the cap, a row at the end warns about the cut.
- Notice columns read Yes, No, No data or Not applicable (active).
- You can do 10 exports per minute, and the limit is shared with Fire’s other reports. If you go over it, the screen tells you how many seconds to wait.
Recipes: how real cases get solved
I can't see the turn-off we made yesterday
I can't see the turn-off we made yesterday
- Check the Turn-off type filter. If it says Incident, scheduled turn-offs do not appear.
- Change it to Both.
- Check that Period includes the date the turn-off was created, not the date it expired.
- Check Store, Channel and Menu: a turn-off with no menu assigned disappears when you pick any of the three.
- Remember the delay of about 5 minutes if the turn-off is very recent.
Which product do we always run out of
Which product do we always run out of
- Leave Period on Last 90 days.
- Pick Both if you also want scheduled turn-offs.
- Look at Recurrent out-of-stock items: they are the store × product pairs with 4 or more turn-offs.
- Compare Times with Distinct days. Many distinct days means a habit, not a bad day.
- Take that list to whoever places the restocking orders for that store.
At what time should we reinforce restocking
At what time should we reinforce restocking
- Pick a store so the map uses its own time zone.
- Look at At what time do items run out?: the brighter cells are the hours with the most turn-offs.
- Cross the day and hour with your delivery calendar. Running out at 3 p.m. every Tuesday is usually a late delivery.
A customer ordered something that was turned off
A customer ordered something that was turned off
- Check whether the amber strip of turn-offs that did not reach all channels is showing.
- Click the customer’s store in Most cases in:.
- Open the product: the turn-off not confirmed tag marks the exact turn-off.
- Solve it from Out of stock and check the configuration of the channel that did not confirm.
I need the detail for a meeting
I need the detail for a meeting
- Apply the filters you want to present.
- Press Export Excel.
- The Detail sheet has every turn-off with its reason. Ranking has the summary per product.
A worked example
Two turn-offs of the same product in the same store:
That is why Times × Average does not equal Time not selling: it is not a bug.
A real case from the sample account, 1 Batata Grande, a combo:
It is the same data: 5 turn-offs that added up to 37 minutes.
Mistakes that cost money
What happens in the odd cases
- A product or store that no longer exists: its internal identifier shows instead of the name.
- “All” with a limited user: it means all your stores. If you have stores in another country, you do not see them until you change the header’s country.
- The load fails: the screen says “The out-of-stock analysis could not be loaded”. If there was already data, it keeps showing it with the error on top. Try again by changing a filter.
- No account picked: the screen asks you to pick an account and a country at the top.
- A user with no stores in that account and country: it says “You do not have stores assigned in this account and country.”

Help inside the screen
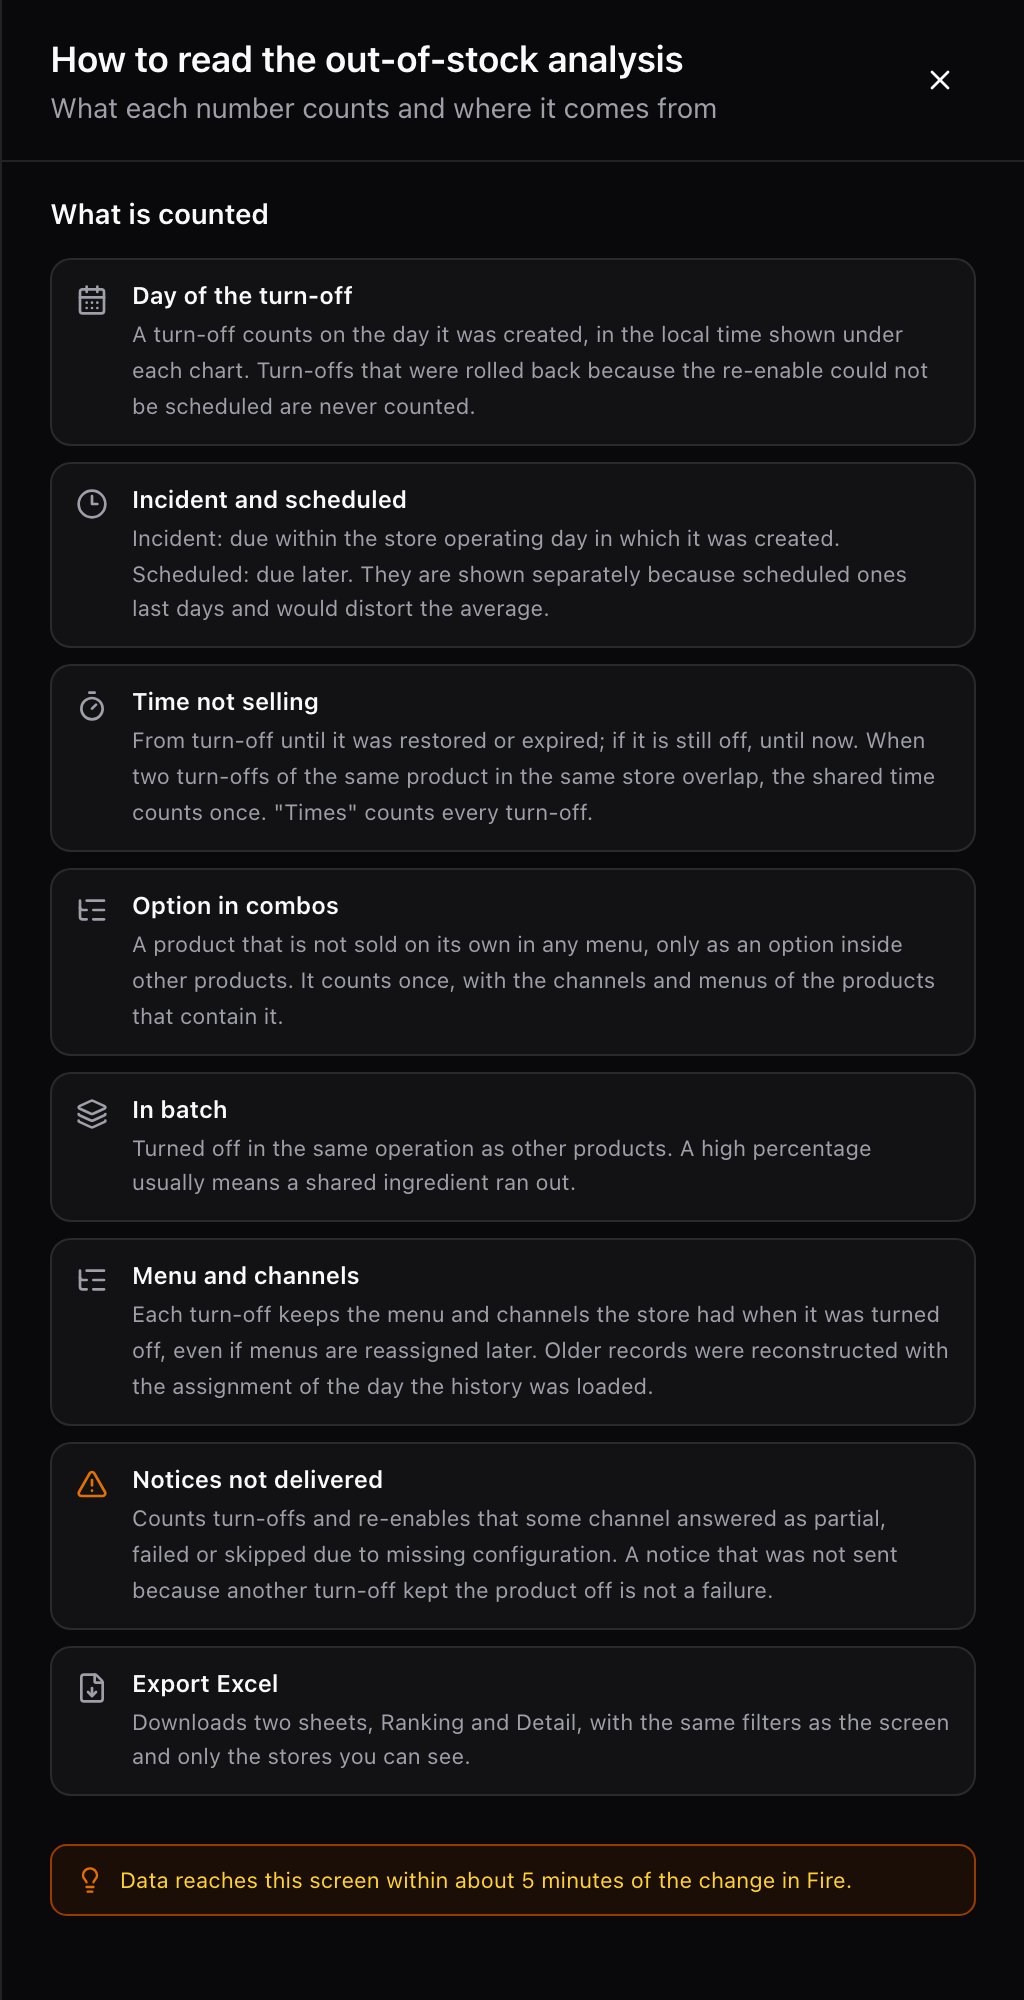
Glossary
Frequently asked questions
Why can't I see any turn-off?
Why can't I see any turn-off?
Almost always it is the Turn-off type filter on Incident. Change it to Both. If it is still empty, check that the period, the store and the other filters include the day the turn-off was created.
Who can see this screen?
Who can see this screen?
Whoever has access to Analytics → Orders, and only with the stores assigned to them, on screen and in the Excel. It has no permission of its own. If you do not see it, ask your administrator for access.
Is it live?
Is it live?
No. The data arrives about 5 minutes after the change in Fire and the screen does not refresh on its own: it updates when you change a filter or reopen it. Updated HH:MM is the time the screen received the data, not the time of the last turn-off.
Why doesn't Times × Average give Time not selling?
Why doesn't Times × Average give Time not selling?
Because time not selling discounts the overlaps between turn-offs of the same product and store, and the average does not. There is a worked example above.
Which day does a multi-day turn-off count on?
Which day does a multi-day turn-off count on?
The day it was created. A scheduled turn-off from Monday to Friday counts once, on Monday, in the chart and in the hour map.
Is there an API for this?
Is there an API for this?
Not a public one. The screen uses internal endpoints that are not documented for integrations. If you need the data outside Fire, use Export Excel.
What is coming
This does not exist today, and there is no committed date for any of it:- Amounts or lost sales per turn-off.
- Automatic screen refresh.
- Alerts when a product reaches 4 turn-offs.
- Exporting more than 500 products in Ranking or more than 20,000 turn-offs in Detail.
- A public API with this data.
- Saving the filters in the screen’s link so it can be shared.